OPEN-SOURCE SCRIPT
Hosoda Waves ABCDE
The Hosoda Waves indicator was devised by Goichi Hosoda, who is also the creator of the Ichimoku system, with the idea that previous highs and lows could determine future price ranges that the market would react to.
Hosoda's projections are the NT, N, V, and E waves, which are derived from calculations based on both upward and downward ABC swings.
Hosoda's waves are derived from the following calculations:
NT Wave = C + (C - A)
N Wave = B + (B - A)
V Wave = B + (B - C)
E Wave = C + (B - A)
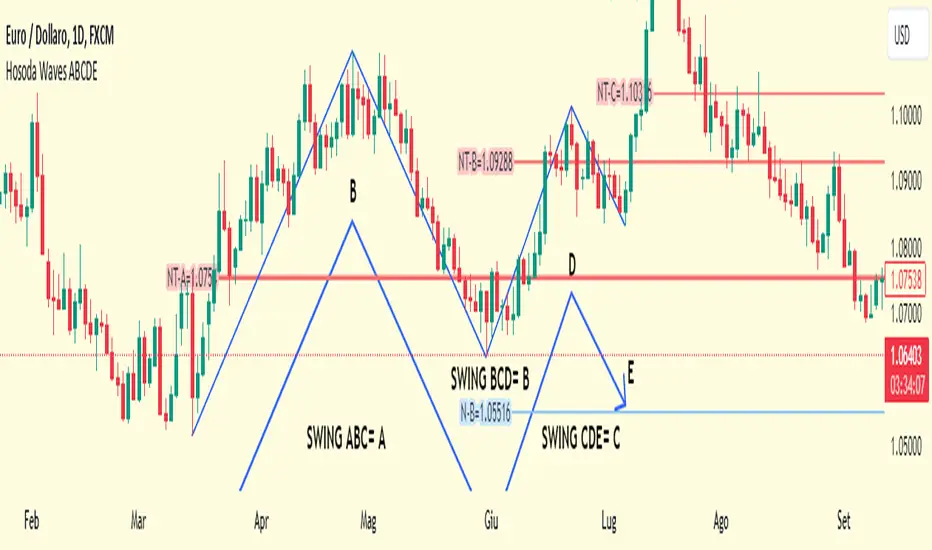
There are already scripts for the Hosoda waves, and my idea is to project an ABCDE swing simultaneously, meaning projecting three swings:
ABC, indicated with an A, resulting in NT-A, N-A, V-A, E-A.
BCD, indicated with a B, resulting in NT-B, N-B, V-B, E-B.
CDE, indicated with a C, resulting in NT-C, N-C, V-C, E-C.
Once the indicator is applied to the chart, the interactive Pine Script tool version 5 will prompt you to identify 5 points of "low-high-low-high-low" or "high-low-high-low-high," both for upward and downward movements and mixed.
Once clicked, these price points can be moved. If you change the time frame or market instrument, the indicator must be removed because it remains tied to the prices where it was initially drawn.
Hosoda's projections are the NT, N, V, and E waves, which are derived from calculations based on both upward and downward ABC swings.
Hosoda's waves are derived from the following calculations:
NT Wave = C + (C - A)
N Wave = B + (B - A)
V Wave = B + (B - C)
E Wave = C + (B - A)
There are already scripts for the Hosoda waves, and my idea is to project an ABCDE swing simultaneously, meaning projecting three swings:
ABC, indicated with an A, resulting in NT-A, N-A, V-A, E-A.
BCD, indicated with a B, resulting in NT-B, N-B, V-B, E-B.
CDE, indicated with a C, resulting in NT-C, N-C, V-C, E-C.
Once the indicator is applied to the chart, the interactive Pine Script tool version 5 will prompt you to identify 5 points of "low-high-low-high-low" or "high-low-high-low-high," both for upward and downward movements and mixed.
Once clicked, these price points can be moved. If you change the time frame or market instrument, the indicator must be removed because it remains tied to the prices where it was initially drawn.
オープンソーススクリプト
TradingViewの精神に則り、このスクリプトの作者はコードをオープンソースとして公開してくれました。トレーダーが内容を確認・検証できるようにという配慮です。作者に拍手を送りましょう!無料で利用できますが、コードの再公開はハウスルールに従う必要があります。
免責事項
この情報および投稿は、TradingViewが提供または推奨する金融、投資、トレード、その他のアドバイスや推奨を意図するものではなく、それらを構成するものでもありません。詳細は利用規約をご覧ください。
オープンソーススクリプト
TradingViewの精神に則り、このスクリプトの作者はコードをオープンソースとして公開してくれました。トレーダーが内容を確認・検証できるようにという配慮です。作者に拍手を送りましょう!無料で利用できますが、コードの再公開はハウスルールに従う必要があります。
免責事項
この情報および投稿は、TradingViewが提供または推奨する金融、投資、トレード、その他のアドバイスや推奨を意図するものではなく、それらを構成するものでもありません。詳細は利用規約をご覧ください。