OPEN-SOURCE SCRIPT
BeautifulStochRSI
BeautifulStochRSI: A Unique and Clear Approach to Stochastic RSI
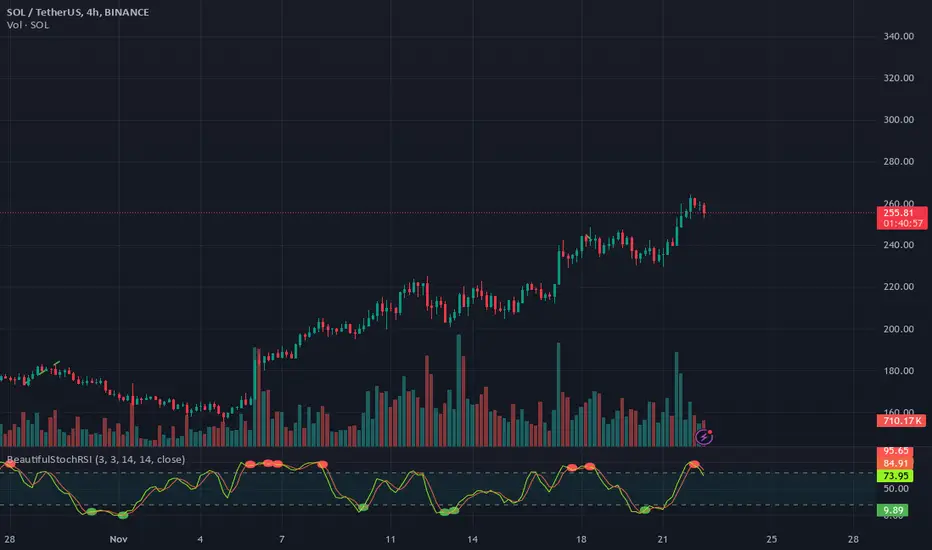
Introducing the BeautifulStochRSI, an colorfull approach to the popular Stochastic RSI indicator. This script goes beyond the standard representation by offering visually distinct and intuitive signals to enhance your trading experience.
The BeautifulStochRSI is ideal for traders who value both precision and simplicity. It combines functional enhancements with a polished design, ensuring that crucial market insights are presented clearly and effectively. Created by rektbyhielke, this script leverages the capabilities of Pine Script™ v5 for optimal performance.
By sharing this script, the aim is not only to provide a practical trading solution but also to inspire others to create indicators that are both beautiful and efficient.
the script includes fully customizable parameters for RSI length, stochastic length, and smoothing factors, allowing traders to tailor the indicator to their specific strategies. Overbought and oversold zones are marked with dots at levels 80 and 20, complemented by a subtle teal background fill to emphasize these areas.
オープンソーススクリプト
TradingViewの精神に則り、このスクリプトの作者はコードをオープンソースとして公開してくれました。トレーダーが内容を確認・検証できるようにという配慮です。作者に拍手を送りましょう!無料で利用できますが、コードの再公開はハウスルールに従う必要があります。
免責事項
この情報および投稿は、TradingViewが提供または推奨する金融、投資、トレード、その他のアドバイスや推奨を意図するものではなく、それらを構成するものでもありません。詳細は利用規約をご覧ください。
オープンソーススクリプト
TradingViewの精神に則り、このスクリプトの作者はコードをオープンソースとして公開してくれました。トレーダーが内容を確認・検証できるようにという配慮です。作者に拍手を送りましょう!無料で利用できますが、コードの再公開はハウスルールに従う必要があります。
免責事項
この情報および投稿は、TradingViewが提供または推奨する金融、投資、トレード、その他のアドバイスや推奨を意図するものではなく、それらを構成するものでもありません。詳細は利用規約をご覧ください。