OPEN-SOURCE SCRIPT
Mehul - ADX Zero Lag
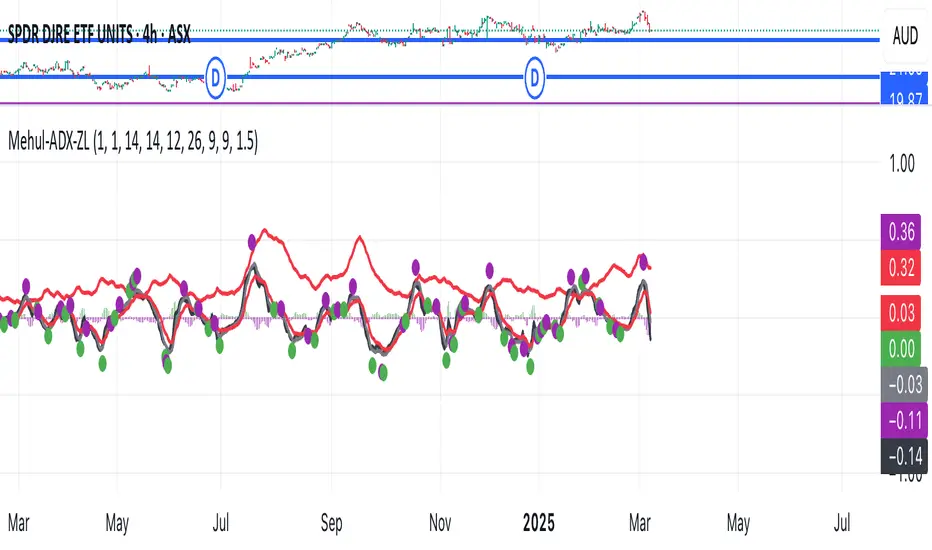
This script combines two popular technical indicators into a single visualization:
1. **Average Directional Index (ADX)**:
- Measures trend strength on a scale from 0-100 (now normalized to 0-1 by dividing by 100)
- Displayed as a red line
- Adjustable smoothing and length parameters
2. **Zero Lag MACD (Modified Moving Average Convergence Divergence)**:
- An enhanced version of the traditional MACD with reduced lag
- Shows the relationship between fast and slow moving averages
- Main components include:
- MACD line (black)
- Signal line (gray)
- Histogram (green for positive, purple for negative)
- EMA of the MACD line (red)
- Optional crossing dots
Key features of the combined indicator:
- **Scale Adjustment**: Both indicators can be scaled independently (adxScale and macdScale parameters)
- **Visibility Toggles**: Each indicator can be shown or hidden
- **Advanced Customization**: Parameters for both indicators can be fine-tuned
- **Algorithm Selection**: Option to choose between the "Glaz" algorithm or the "real" zero lag algorithm
- **Display Options**: Toggles for visualization elements like crossing dots
The most significant technical aspect is that both indicators are displayed in the same pane with compatible scaling, achieved by normalizing the ADX values and applying user-defined scale factors to both indicators.
This combined indicator is designed to give traders a comprehensive view of both trend strength (from ADX) and momentum/direction (from Zero Lag MACD) in a single, easy-to-read visualization.
オープンソーススクリプト
TradingViewの精神に則り、このスクリプトの作者はコードをオープンソースとして公開してくれました。トレーダーが内容を確認・検証できるようにという配慮です。作者に拍手を送りましょう!無料で利用できますが、コードの再公開はハウスルールに従う必要があります。
免責事項
この情報および投稿は、TradingViewが提供または推奨する金融、投資、トレード、その他のアドバイスや推奨を意図するものではなく、それらを構成するものでもありません。詳細は利用規約をご覧ください。
オープンソーススクリプト
TradingViewの精神に則り、このスクリプトの作者はコードをオープンソースとして公開してくれました。トレーダーが内容を確認・検証できるようにという配慮です。作者に拍手を送りましょう!無料で利用できますが、コードの再公開はハウスルールに従う必要があります。
免責事項
この情報および投稿は、TradingViewが提供または推奨する金融、投資、トレード、その他のアドバイスや推奨を意図するものではなく、それらを構成するものでもありません。詳細は利用規約をご覧ください。