OPEN-SOURCE SCRIPT
更新済 TRI - Quick Analysis
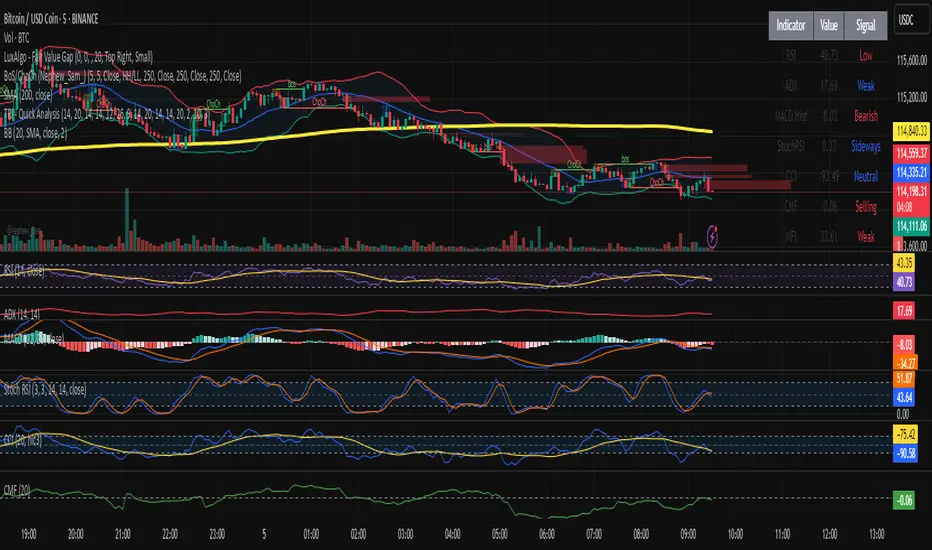
"TRI - Quick Analysis" is a multi-indicator dashboard designed to give traders an immediate overview of market momentum, trend strength, volume flow, and volatility.
It visually summarizes key technical indicators in a compact table, including:
Each value is color-coded (green, red, blue) based on whether it's favorable, unfavorable, or neutral for a potential long position.
At the bottom of the table, a summary score dynamically aggregates signals from all indicators and provides a simple trading score.
This tool is designed for discretionary traders looking for a quick, color-coded insight into current market conditions without relying on a single signal.
It visually summarizes key technical indicators in a compact table, including:
- RSI (momentum)
- MACD Histogram (trend momentum)
- ADX + SuperTrend (trend strength & direction)
- StochRSI (oversold/overbought)
- CCI (price deviation)
- CMF (volume flow)
- MFI (volume-weighted momentum)
- OBV (cumulative volume pressure)
- ATR (volatility)
- %B Bollinger (position within Bollinger Bands)
Each value is color-coded (green, red, blue) based on whether it's favorable, unfavorable, or neutral for a potential long position.
At the bottom of the table, a summary score dynamically aggregates signals from all indicators and provides a simple trading score.
This tool is designed for discretionary traders looking for a quick, color-coded insight into current market conditions without relying on a single signal.
リリースノート
TRI - Quick Analysis is a multi-indicator dashboard designed to give traders an immediate overview of market momentum, trend strength, volume flow, and volatility.It visually summarizes key technical indicators in a compact table, including:
- RSI (momentum)
- MACD Histogram (trend momentum)
- ADX + SuperTrend (trend strength & direction)
- StochRSI (oversold/overbought)
- CCI (price deviation)
- CMF (volume flow)
- MFI (volume-weighted momentum)
- OBV (cumulative volume pressure)
- ATR (volatility)
- %B Bollinger (position within Bollinger Bands)
Each value is color-coded (green, red, blue) based on whether it's favorable, unfavorable, or neutral for a potential long position.
At the bottom of the table, a summary score dynamically aggregates signals from all indicators and provides a simple trading score.
This tool is designed for discretionary traders looking for a quick, color-coded insight into current market conditions without relying on a single signal.
オープンソーススクリプト
TradingViewの精神に則り、このスクリプトの作者はコードをオープンソースとして公開してくれました。トレーダーが内容を確認・検証できるようにという配慮です。作者に拍手を送りましょう!無料で利用できますが、コードの再公開はハウスルールに従う必要があります。
免責事項
この情報および投稿は、TradingViewが提供または推奨する金融、投資、トレード、その他のアドバイスや推奨を意図するものではなく、それらを構成するものでもありません。詳細は利用規約をご覧ください。
オープンソーススクリプト
TradingViewの精神に則り、このスクリプトの作者はコードをオープンソースとして公開してくれました。トレーダーが内容を確認・検証できるようにという配慮です。作者に拍手を送りましょう!無料で利用できますが、コードの再公開はハウスルールに従う必要があります。
免責事項
この情報および投稿は、TradingViewが提供または推奨する金融、投資、トレード、その他のアドバイスや推奨を意図するものではなく、それらを構成するものでもありません。詳細は利用規約をご覧ください。