OPEN-SOURCE SCRIPT
Linear Regression Slope
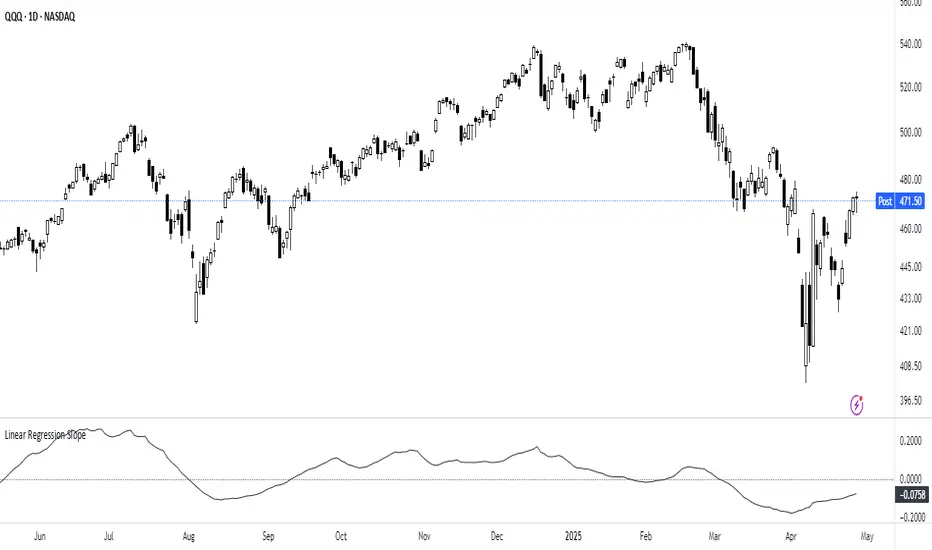
The Linear Regression Slope provides a quantitative measure of trend direction. It fits a linear regression line to the past N closing prices and calculates the slope, representing the average rate of price change per bar.
To ensure comparability across assets and timeframes, the slope is normalized by the ATR over a shorter window. This produces a volatility-adjusted measure which allows for the slope to be interpreted relative to typical price fluctuations.
Mathematically, the slope is derived by minimizing the sum of squared deviations between actual prices and the fitted regression line. A positive normalized slope indicate upwards movement; a negative slope indicate downwards movement. Persistent values near zero could indicate an absence of clear trend, with price dominated by short-term fluctuations or noise.
The definition of a trend depends on the period of observation. The lookback setting should be set based on to the desired timeframe. Shorter lookbacks will respond faster to recent changes but may be more sensitive to noise, while longer lookbacks will emphasize broader structures.
While effective at quantifying existing trends, this method is not predictive. Sudden regime changes, volatility shocks, and non-linear dynamics can all cause rapid slope reversals. Therefore, it is best applied as part of a broader analytical framework.
In summary, the Linear Regression Slope quantifies price direction and serves as a measurable supplement to the visual assessment of trends on price charts.
Additional Features:
- Option to display or hide the normalized slope line.
- Option to enable background coloring when the slope is above or below zero.
オープンソーススクリプト
TradingViewの精神に則り、このスクリプトの作者はコードをオープンソースとして公開してくれました。トレーダーが内容を確認・検証できるようにという配慮です。作者に拍手を送りましょう!無料で利用できますが、コードの再公開はハウスルールに従う必要があります。
Technical Trading: Research and Application
stockleave.com/
stockleave.com/
免責事項
この情報および投稿は、TradingViewが提供または推奨する金融、投資、トレード、その他のアドバイスや推奨を意図するものではなく、それらを構成するものでもありません。詳細は利用規約をご覧ください。