OPEN-SOURCE SCRIPT
Dynamic Price Zone
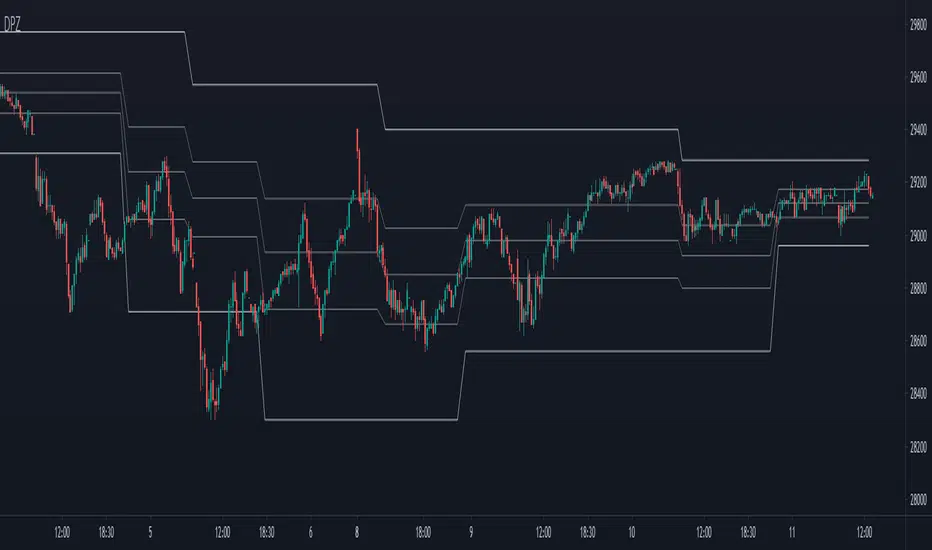
This indicator dynamically divides the price range into six zones.
1. Over Resistance (Strong up trend)
2. UpperMiddle to Resistance
3. Middle to UpperMiddle
4. Middle to LowerMiidle
5. LowerMiddle to Support
6. Under Support (Strong down Trend)
Resistance and Support are calculated by HMA.
Usage:
It is recommended to use this indicator on the higher time frames.
The image is 15 minutes chart and resolution 1hour for indicator.
- Pay attention to whether the range from resistance to support is shrinking or expanding!
- A major trend begins with a break in resistance and support.
- The five lines also work as a support or resistance.
- When the zone changes, the price is likely to reach the next line.
- UpperMiddle and LowerMiddle settings can be selected from 3 types.
- 75%, 66%, 61.8%(fibonacci) for UpperMiddle.
オープンソーススクリプト
TradingViewの精神に則り、このスクリプトの作者はコードをオープンソースとして公開してくれました。トレーダーが内容を確認・検証できるようにという配慮です。作者に拍手を送りましょう!無料で利用できますが、コードの再公開はハウスルールに従う必要があります。
免責事項
この情報および投稿は、TradingViewが提供または推奨する金融、投資、トレード、その他のアドバイスや推奨を意図するものではなく、それらを構成するものでもありません。詳細は利用規約をご覧ください。
オープンソーススクリプト
TradingViewの精神に則り、このスクリプトの作者はコードをオープンソースとして公開してくれました。トレーダーが内容を確認・検証できるようにという配慮です。作者に拍手を送りましょう!無料で利用できますが、コードの再公開はハウスルールに従う必要があります。
免責事項
この情報および投稿は、TradingViewが提供または推奨する金融、投資、トレード、その他のアドバイスや推奨を意図するものではなく、それらを構成するものでもありません。詳細は利用規約をご覧ください。