OPEN-SOURCE SCRIPT
Bitcoin Fibonacci Log Regression
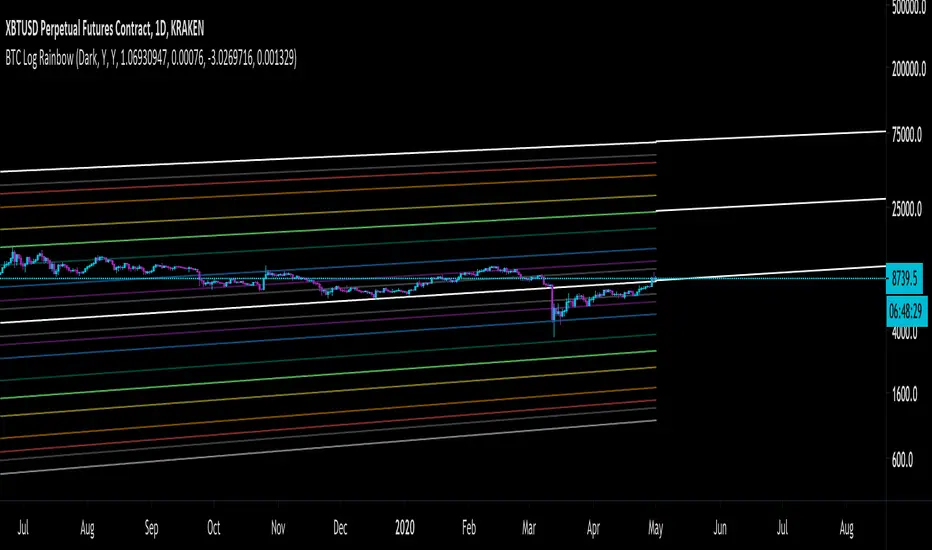
The "Zero Line" is the calculated logarithmic regression of Bitcoin over the last decade.
The rainbow above the Zero Line are the Fibonacci multiples from 0 --> 1 of the log regression (0.236, 0.382, etc.)
The rainbow below the Zero Line is identical, except that the multiples are negative (-0.236, -0.382, etc.)
For the first time ever, Bitcoin broke through the Zero Line (the natural regression) when it dumped on March 12-13. It looked at though the regression was invalidated when, in fact, it simply made an unprecedented move to a lower Fibonacci multiple.
Enjoy.
オープンソーススクリプト
TradingViewの精神に則り、このスクリプトの作者はコードをオープンソースとして公開してくれました。トレーダーが内容を確認・検証できるようにという配慮です。作者に拍手を送りましょう!無料で利用できますが、コードの再公開はハウスルールに従う必要があります。
免責事項
この情報および投稿は、TradingViewが提供または推奨する金融、投資、トレード、その他のアドバイスや推奨を意図するものではなく、それらを構成するものでもありません。詳細は利用規約をご覧ください。
オープンソーススクリプト
TradingViewの精神に則り、このスクリプトの作者はコードをオープンソースとして公開してくれました。トレーダーが内容を確認・検証できるようにという配慮です。作者に拍手を送りましょう!無料で利用できますが、コードの再公開はハウスルールに従う必要があります。
免責事項
この情報および投稿は、TradingViewが提供または推奨する金融、投資、トレード、その他のアドバイスや推奨を意図するものではなく、それらを構成するものでもありません。詳細は利用規約をご覧ください。