OPEN-SOURCE SCRIPT
Catastrophe Distance
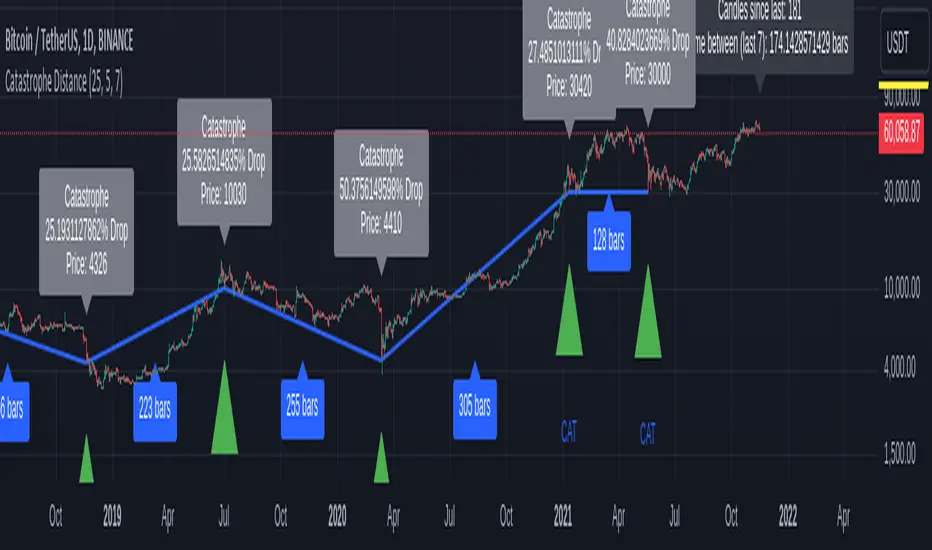
Catastrophe Distance is a tool to visually explore the time between catastrophic price moves.
Catastrophes are defined with 2 variables:
drawdown_threshold: the amount of percent the price has to fall
lookback_period = the amount of last candles in which drawdown_threshold was reached.
Drawdown_threshold per default is 25% and lookback_period is 5, meaning per default if price moves -25% in the last 5 candles you have a catastrophe.
Feel free to play around with this values to fit all the events you consider a catastrophe.
This indicator does not provide signals. It however implies caution if the time since the last catastrophe is higher then the average time between catastrophes (of last x catastrophes).
This is marked by the label over the current price showing the actual and average time since last catastrophe turning from green to black.
Given that the distance between catastrophes is somewhat cyclical:
Maybe now is a good time to start phishing for low limit orders and reduce leverage?
オープンソーススクリプト
TradingViewの精神に則り、このスクリプトの作者はコードをオープンソースとして公開してくれました。トレーダーが内容を確認・検証できるようにという配慮です。作者に拍手を送りましょう!無料で利用できますが、コードの再公開はハウスルールに従う必要があります。
免責事項
この情報および投稿は、TradingViewが提供または推奨する金融、投資、トレード、その他のアドバイスや推奨を意図するものではなく、それらを構成するものでもありません。詳細は利用規約をご覧ください。
オープンソーススクリプト
TradingViewの精神に則り、このスクリプトの作者はコードをオープンソースとして公開してくれました。トレーダーが内容を確認・検証できるようにという配慮です。作者に拍手を送りましょう!無料で利用できますが、コードの再公開はハウスルールに従う必要があります。
免責事項
この情報および投稿は、TradingViewが提供または推奨する金融、投資、トレード、その他のアドバイスや推奨を意図するものではなく、それらを構成するものでもありません。詳細は利用規約をご覧ください。