OPEN-SOURCE SCRIPT
Dynamic Levels
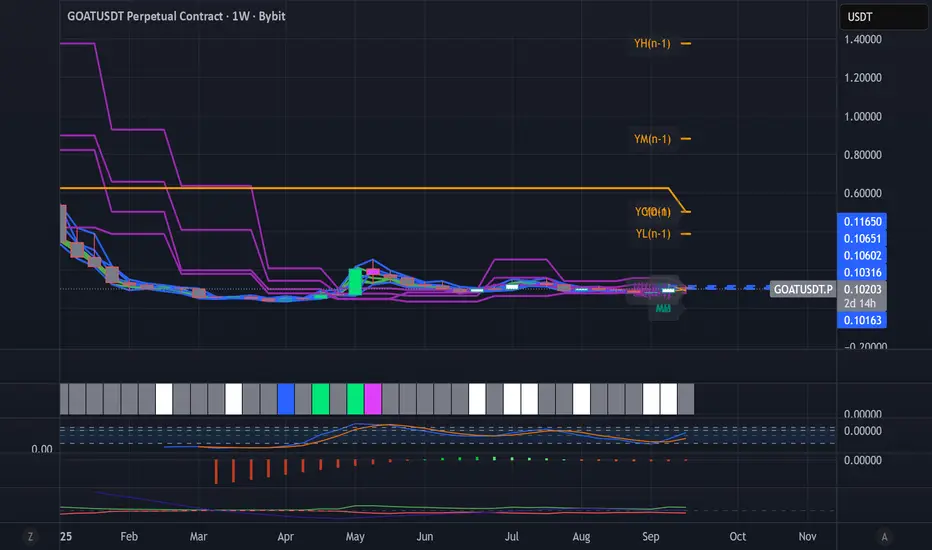
This indicator plots key price levels (Open, High, Low, Mid, Close) from multiple higher timeframes (Monday, Daily, Weekly, Monthly, Yearly).
It allows you to track how price interacts with important reference levels without switching timeframes.
🔑 Features
✅ Monday levels (MO, MH, MM)
By default: shows the last completed Monday (fixed values).
Option: “live mode” to update Monday High/Low/Mid while Monday’s candle is forming.
✅ Daily levels (DO, DH, DL, DM, DC)
Live: Daily High/Low/Mid update dynamically while today’s candle is forming.
Previous Daily Close (DC) is always fixed.
✅ Weekly levels (WO, WH, WL, WM)
Live: Weekly High/Low/Mid update dynamically while this week’s candle is forming.
Weekly Open is fixed.
✅ Monthly levels (MO(n), MH(n-1), ML(n-1), MM(n-1), MC(n-1))
Shows last completed month’s values (constant, never changing).
Current Monthly Open is also shown (naturally fixed).
✅ Yearly levels (YO(n), YH(n-1), YL(n-1), YM(n-1), YC(n-1))
Shows last completed year’s values (constant, never changing).
Current Yearly Open is also shown (naturally fixed).
🎨 Customization
Toggle each level (on/off) in indicator settings.
Individual color settings for Monday, Daily, Weekly, Monthly, and Yearly.
Adjustable line width and transparency.
Optional short labels (MO, DO, WM, etc.) displayed on the right side of the chart.
🔄 Dynamic Logic
Daily and Weekly → update dynamically while their candle is forming.
Monday, Monthly, and Yearly → use fixed values from the last completed bar (do not “breathe”).
📌 Use cases
Quickly see where price stands relative to previous close, current open, or mid-levels.
Use Monday Open/High/Mid as strong intraday references.
Use Monthly/Yearly levels as long-term support/resistance zones.
オープンソーススクリプト
TradingViewの精神に則り、このスクリプトの作者はコードをオープンソースとして公開してくれました。トレーダーが内容を確認・検証できるようにという配慮です。作者に拍手を送りましょう!無料で利用できますが、コードの再公開はハウスルールに従う必要があります。
免責事項
この情報および投稿は、TradingViewが提供または推奨する金融、投資、トレード、その他のアドバイスや推奨を意図するものではなく、それらを構成するものでもありません。詳細は利用規約をご覧ください。
オープンソーススクリプト
TradingViewの精神に則り、このスクリプトの作者はコードをオープンソースとして公開してくれました。トレーダーが内容を確認・検証できるようにという配慮です。作者に拍手を送りましょう!無料で利用できますが、コードの再公開はハウスルールに従う必要があります。
免責事項
この情報および投稿は、TradingViewが提供または推奨する金融、投資、トレード、その他のアドバイスや推奨を意図するものではなく、それらを構成するものでもありません。詳細は利用規約をご覧ください。