OPEN-SOURCE SCRIPT
Spider Lines For Bitcoin (Daily And Weekly)
I haven't seen any indicator do this, so I decided to publish this to form automatic Spider Charts without actually going through the effort of drawing them!
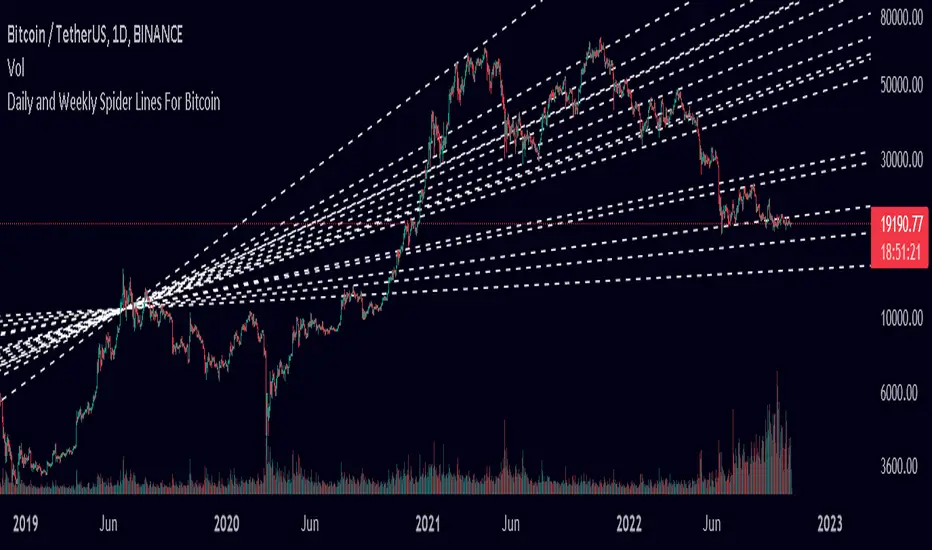
This script charts dotted lines (spider lines) all over, depicting support and resistance levels.
It works by connecting some candles from the 2018 bear market to the candle from 1st July 2019, followed by extending the lines to the right, making support and resistance levels for the future. The script works only for the daily and weekly charts for Bitcoin.
The levels are accurate to a good extent.
If the lines don't load, zoom out until the 2018 bear market top and it should load then.
Have fun with this indicator!
オープンソーススクリプト
TradingViewの精神に則り、このスクリプトの作者はコードをオープンソースとして公開してくれました。トレーダーが内容を確認・検証できるようにという配慮です。作者に拍手を送りましょう!無料で利用できますが、コードの再公開はハウスルールに従う必要があります。
免責事項
この情報および投稿は、TradingViewが提供または推奨する金融、投資、トレード、その他のアドバイスや推奨を意図するものではなく、それらを構成するものでもありません。詳細は利用規約をご覧ください。
オープンソーススクリプト
TradingViewの精神に則り、このスクリプトの作者はコードをオープンソースとして公開してくれました。トレーダーが内容を確認・検証できるようにという配慮です。作者に拍手を送りましょう!無料で利用できますが、コードの再公開はハウスルールに従う必要があります。
免責事項
この情報および投稿は、TradingViewが提供または推奨する金融、投資、トレード、その他のアドバイスや推奨を意図するものではなく、それらを構成するものでもありません。詳細は利用規約をご覧ください。