OPEN-SOURCE SCRIPT
更新済 StonkGame AutoLevels+
Hey gang — made a new levels script to automatically plot the ones I use the most.
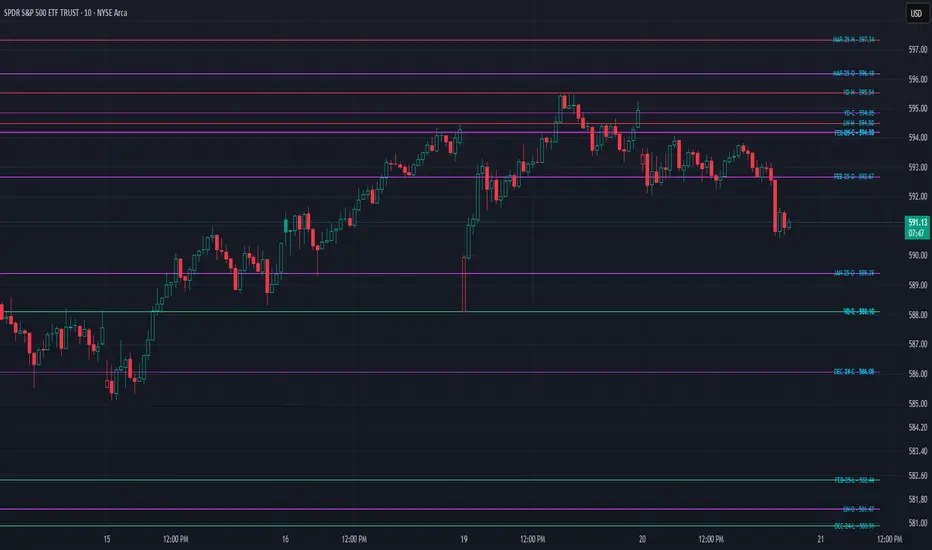
StonkGame AutoLevels+ automatically plots structural price levels from major timeframes — including Yesterday, Last Week, Last Month, Last Quarter, and Last Year — with the option to include up to 6 months of historical monthly open, high, low, and close levels.
Everything’s fully customizable. You pick which timeframes to show, which price types (O/H/L/C) matter, and where the labels appear. Highs are red, lows are lime. Monthly opens are fuchsia, closes are purple — easy to separate at a glance.
Labels auto-stagger to reduce clutter and can be positioned left, right, or center — or turned off completely. You also control how far they sit from price.
The screenshot shows everything turned on just to demo the range — but in practice, I usually stick with the standard levels like Last Week or Last Month, and only show highs and lows (they define structure best IMO).
Clean, contextual, and built for traders who want clarity without noise.
リリースノート
Fixed the monthly label logic to ensure accurate month and year tags for each OHLC level. The previous method used an offset-based approach that could mismatch the actual month, especially on intraday charts, leading to incorrect labels like showing "APR-24" when it was actually May. The update now pulls the exact timestamp from each monthly bar and derives the label directly from that, so labels always reflect the correct calendar month associated with the price levels.リリースノート
Update #2: some further bug fixes for labels, and input layout changes to make it more intuitive,ordered.リリースノート
Removed the static timeframe options for last month and last quarter, as it was redundant with the 6 monthly lookback levels and could cause clutter and was just extra code. Also changed some default cosmetic settings to what I think is most helpful visually. オープンソーススクリプト
TradingViewの精神に則り、このスクリプトの作者はコードをオープンソースとして公開してくれました。トレーダーが内容を確認・検証できるようにという配慮です。作者に拍手を送りましょう!無料で利用できますが、コードの再公開はハウスルールに従う必要があります。
免責事項
この情報および投稿は、TradingViewが提供または推奨する金融、投資、トレード、その他のアドバイスや推奨を意図するものではなく、それらを構成するものでもありません。詳細は利用規約をご覧ください。
オープンソーススクリプト
TradingViewの精神に則り、このスクリプトの作者はコードをオープンソースとして公開してくれました。トレーダーが内容を確認・検証できるようにという配慮です。作者に拍手を送りましょう!無料で利用できますが、コードの再公開はハウスルールに従う必要があります。
免責事項
この情報および投稿は、TradingViewが提供または推奨する金融、投資、トレード、その他のアドバイスや推奨を意図するものではなく、それらを構成するものでもありません。詳細は利用規約をご覧ください。