OPEN-SOURCE SCRIPT
更新済 Avg.ROC Table
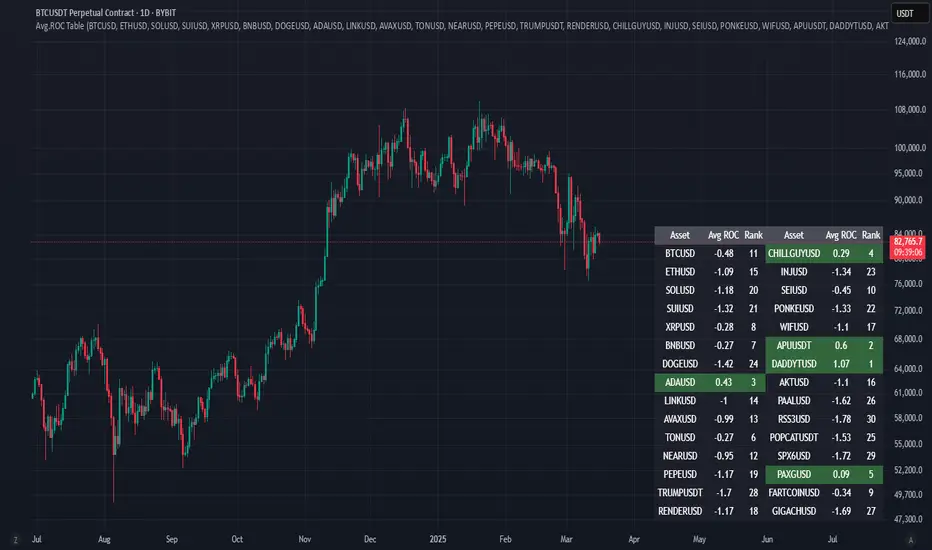
This indicator calculates the average Rate of Change (ROC) for up to 30 user-selected assets over a specified number of candles. It then ranks the assets—assigning rank 1 to the asset with the highest average ROC (strongest momentum) and rank 30 to the asset with the lowest. The results are displayed in a clean, easy-to-read table split into two stacks of 15 assets each, allowing you to quickly see which assets are performing best.
リリースノート
This indicator calculates the average Rate of Change (ROC) for up to 30 user-selected assets over a specified number of candles. It then ranks the assets—assigning rank 1 to the asset with the highest average ROC (strongest momentum) and rank 30 to the asset with the lowest. The results are displayed in a clean, easy-to-read table highlighting the top 5 strongest assets, allowing you to quickly see which assets are performing best.
オープンソーススクリプト
TradingViewの精神に則り、このスクリプトの作者はコードをオープンソースとして公開してくれました。トレーダーが内容を確認・検証できるようにという配慮です。作者に拍手を送りましょう!無料で利用できますが、コードの再公開はハウスルールに従う必要があります。
免責事項
この情報および投稿は、TradingViewが提供または推奨する金融、投資、トレード、その他のアドバイスや推奨を意図するものではなく、それらを構成するものでもありません。詳細は利用規約をご覧ください。
オープンソーススクリプト
TradingViewの精神に則り、このスクリプトの作者はコードをオープンソースとして公開してくれました。トレーダーが内容を確認・検証できるようにという配慮です。作者に拍手を送りましょう!無料で利用できますが、コードの再公開はハウスルールに従う必要があります。
免責事項
この情報および投稿は、TradingViewが提供または推奨する金融、投資、トレード、その他のアドバイスや推奨を意図するものではなく、それらを構成するものでもありません。詳細は利用規約をご覧ください。