OPEN-SOURCE SCRIPT
更新済 kou_di

The Simple Moving Average (SMA) is the most basic and widely used type of moving average. It’s calculated by taking the arithmetic mean of a given set of prices or data points over a specified period.
SMA = (P1 + P2 + ... + Pn) /n
Where
P1, P2, ... , Pn = prices of data points
n = number of periods
When a new SMA is calculated for a new candle stick, the oldest data point P1 is removed from the original data points (P1 + P2 + ... + Pn) and a new price Pn+1 is added to form a new SMA:
SMA_new = (P2 + ... + Pn + Pn+1) /n
If Pn+1 < P1, SMA line will become downward trend, or if Pn+1 > P1, SMA line will become upward trend. This logic help us predict the moving direction of SMA line which will form the prices trend in the future.
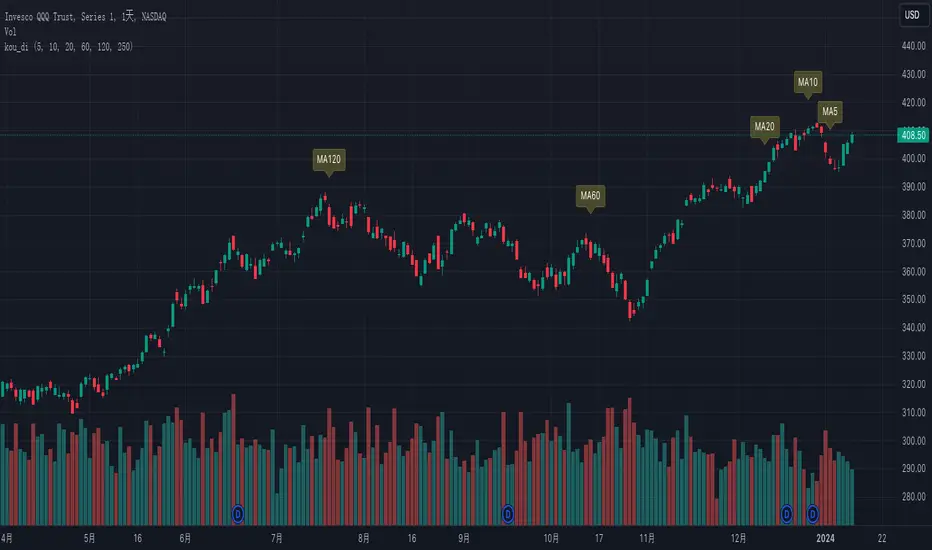
So it's important to highlight the "P1" candle stick for SMAs of different periods to help us predict the trend of SMA lines.
Since SMA5, SMA10, SMA20, SMA60, SMA120, SMA250 are the most popular SMAs, this indicator marks the "P1" candle stick for all of them by default, but you can optionally disable them.
该指标用于显示SMA5, SMA10, SMA20, SMA60, SMA120, SMA250 的扣抵位来监测均线拐点的出现
リリースノート
Fix a bugリリースノート
Update the display of labelsリリースノート
Addressed comment - Allow changing the color of label and label textオープンソーススクリプト
TradingViewの精神に則り、このスクリプトの作者はコードをオープンソースとして公開してくれました。トレーダーが内容を確認・検証できるようにという配慮です。作者に拍手を送りましょう!無料で利用できますが、コードの再公開はハウスルールに従う必要があります。
免責事項
この情報および投稿は、TradingViewが提供または推奨する金融、投資、トレード、その他のアドバイスや推奨を意図するものではなく、それらを構成するものでもありません。詳細は利用規約をご覧ください。
オープンソーススクリプト
TradingViewの精神に則り、このスクリプトの作者はコードをオープンソースとして公開してくれました。トレーダーが内容を確認・検証できるようにという配慮です。作者に拍手を送りましょう!無料で利用できますが、コードの再公開はハウスルールに従う必要があります。
免責事項
この情報および投稿は、TradingViewが提供または推奨する金融、投資、トレード、その他のアドバイスや推奨を意図するものではなく、それらを構成するものでもありません。詳細は利用規約をご覧ください。