OPEN-SOURCE SCRIPT
Relative Strength Overlay
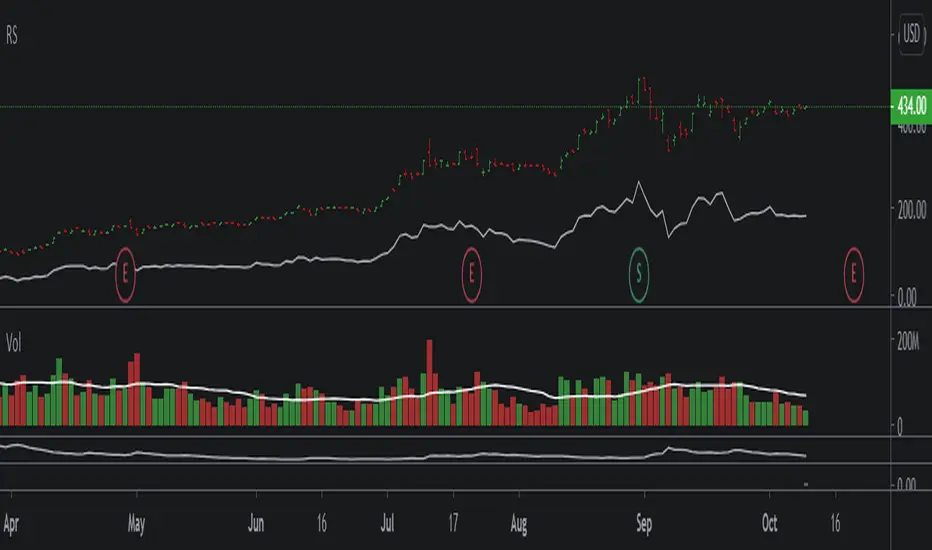
This is the original script to my other Relative Strength indicator (link below) It provides a graphical overlay of the Relative Strength, compared to the QLD, a Nasdaq x2 ETF.
You can not use the value to compare to other stocks or securities, as it is scaled based on the price (so it can be used as an overlay).
If you want a value which you can use to compare with other stocks, please see my other Relative Strength indicator.
You can not use the value to compare to other stocks or securities, as it is scaled based on the price (so it can be used as an overlay).
If you want a value which you can use to compare with other stocks, please see my other Relative Strength indicator.
オープンソーススクリプト
TradingViewの精神に則り、このスクリプトの作者はコードをオープンソースとして公開してくれました。トレーダーが内容を確認・検証できるようにという配慮です。作者に拍手を送りましょう!無料で利用できますが、コードの再公開はハウスルールに従う必要があります。
免責事項
この情報および投稿は、TradingViewが提供または推奨する金融、投資、トレード、その他のアドバイスや推奨を意図するものではなく、それらを構成するものでもありません。詳細は利用規約をご覧ください。
オープンソーススクリプト
TradingViewの精神に則り、このスクリプトの作者はコードをオープンソースとして公開してくれました。トレーダーが内容を確認・検証できるようにという配慮です。作者に拍手を送りましょう!無料で利用できますが、コードの再公開はハウスルールに従う必要があります。
免責事項
この情報および投稿は、TradingViewが提供または推奨する金融、投資、トレード、その他のアドバイスや推奨を意図するものではなく、それらを構成するものでもありません。詳細は利用規約をご覧ください。