OPEN-SOURCE SCRIPT
Candle Rating (1–5)
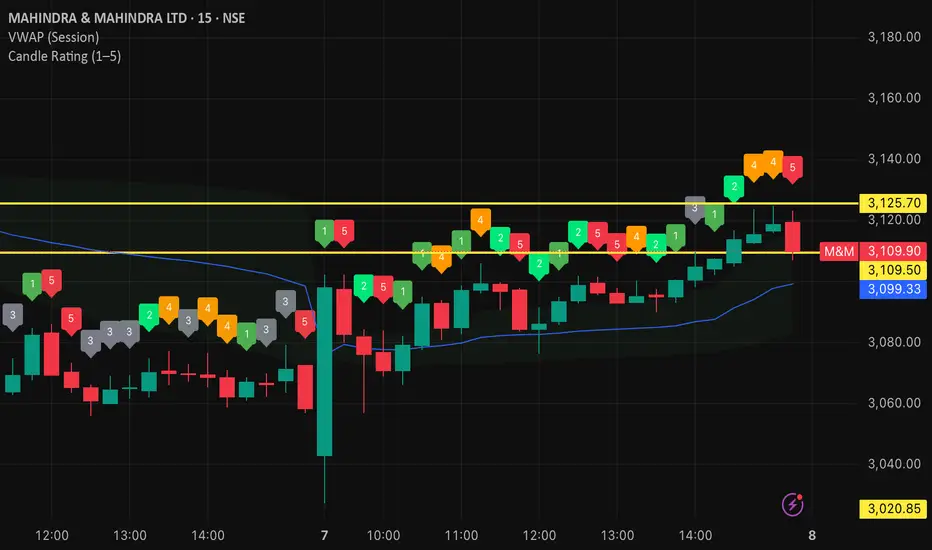
This “Candle Rating (1–5)” indicator measures where each bar’s close sits within its own high-low range and assigns a simple strength score:
Range Calculation
It computes the candle’s total range (high − low) and finds the close’s position as a percentage of that range (0 = close at low, 1 = close at high).
Five-Point Rating
1 (Strong Buy): Close in the top 20% of the range
2 (Moderate Buy): 60–80%
3 (Neutral): 40–60%
4 (Moderate Sell): 20–40%
5 (Strong Sell): Bottom 20%
Visual Feedback
It plots the numeric rating above each bar (colored green → red), giving you an at-a-glance read of candle momentum and potential reversal strength across any timeframe.
オープンソーススクリプト
TradingViewの精神に則り、このスクリプトの作者はコードをオープンソースとして公開してくれました。トレーダーが内容を確認・検証できるようにという配慮です。作者に拍手を送りましょう!無料で利用できますが、コードの再公開はハウスルールに従う必要があります。
免責事項
この情報および投稿は、TradingViewが提供または推奨する金融、投資、トレード、その他のアドバイスや推奨を意図するものではなく、それらを構成するものでもありません。詳細は利用規約をご覧ください。
オープンソーススクリプト
TradingViewの精神に則り、このスクリプトの作者はコードをオープンソースとして公開してくれました。トレーダーが内容を確認・検証できるようにという配慮です。作者に拍手を送りましょう!無料で利用できますが、コードの再公開はハウスルールに従う必要があります。
免責事項
この情報および投稿は、TradingViewが提供または推奨する金融、投資、トレード、その他のアドバイスや推奨を意図するものではなく、それらを構成するものでもありません。詳細は利用規約をご覧ください。