OPEN-SOURCE SCRIPT
更新済 Average Yield Inversion
Description:
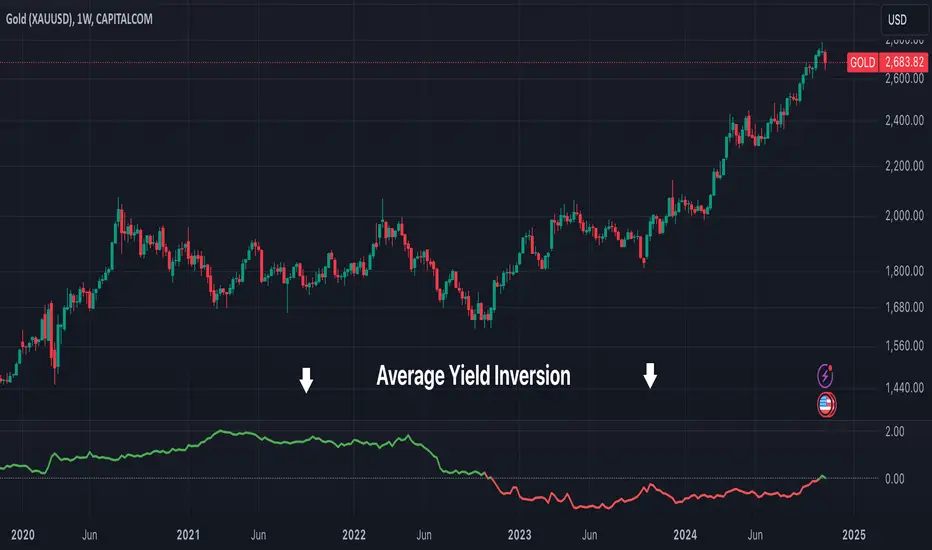
This script calculates and visualizes the average yield curve spread to identify whether the yield curve is inverted or normal. It takes into account short-term yields (1M, 3M, 6M, 2Y) and long-term yields (10Y, 30Y).
Key Features:
This tool is perfect for investors, analysts, and economists who need to monitor yield curve dynamics at a glance.
This script calculates and visualizes the average yield curve spread to identify whether the yield curve is inverted or normal. It takes into account short-term yields (1M, 3M, 6M, 2Y) and long-term yields (10Y, 30Y).
- Positive values: The curve is normal, indicating long-term yields are higher than short-term yields. This often reflects economic growth expectations.
- Negative values: The curve is inverted, meaning short-term yields are higher than long-term yields, a potential signal of economic slowdown or recession.
Key Features:
- Calculates the average spread between long-term and short-term yields.
- Displays a clear graph with a zero-line reference for quick interpretation.
- Useful for tracking macroeconomic trends and potential market turning points.
This tool is perfect for investors, analysts, and economists who need to monitor yield curve dynamics at a glance.
リリースノート
Added red color for inversion and green for non inversionリリースノート
Update: removed Chart to show the indicator onlyリリースノート
Update: added symbol and chart for comparisonリリースノート
Update: added titleオープンソーススクリプト
TradingViewの精神に則り、このスクリプトの作者はコードをオープンソースとして公開してくれました。トレーダーが内容を確認・検証できるようにという配慮です。作者に拍手を送りましょう!無料で利用できますが、コードの再公開はハウスルールに従う必要があります。
免責事項
この情報および投稿は、TradingViewが提供または推奨する金融、投資、トレード、その他のアドバイスや推奨を意図するものではなく、それらを構成するものでもありません。詳細は利用規約をご覧ください。
オープンソーススクリプト
TradingViewの精神に則り、このスクリプトの作者はコードをオープンソースとして公開してくれました。トレーダーが内容を確認・検証できるようにという配慮です。作者に拍手を送りましょう!無料で利用できますが、コードの再公開はハウスルールに従う必要があります。
免責事項
この情報および投稿は、TradingViewが提供または推奨する金融、投資、トレード、その他のアドバイスや推奨を意図するものではなく、それらを構成するものでもありません。詳細は利用規約をご覧ください。