OPEN-SOURCE SCRIPT
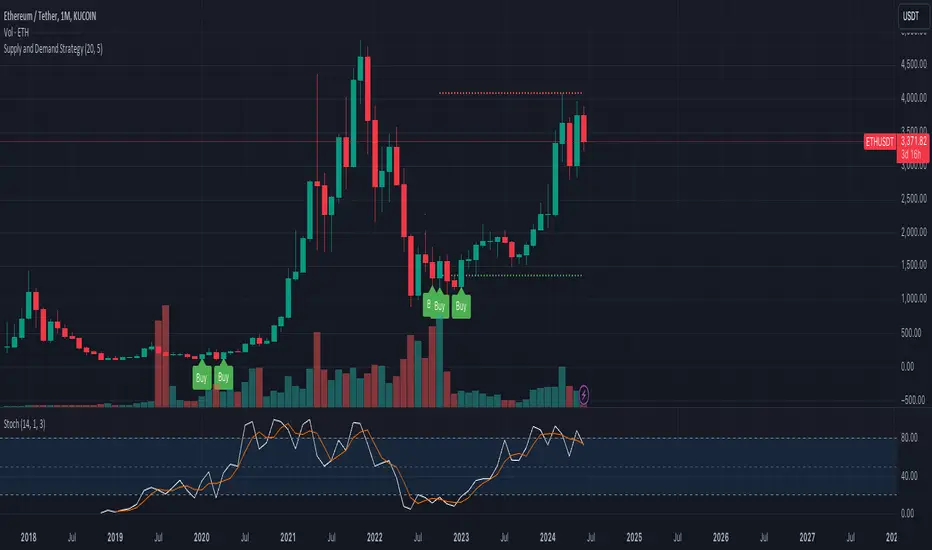
Supply and Demand Strategy

Overview
This strategy is designed to identify key supply (resistance) and demand (support) zones on a price chart. These zones represent areas where the price has historically shown a significant reaction, either bouncing up from a demand zone or dropping down from a supply zone. The strategy provides clear entry and exit points for trades based on these zones.
Key Components
Supply and Demand Zones:
Supply Zone: An area where the price has reversed from an uptrend to a downtrend. It represents a high concentration of sellers.
Demand Zone: An area where the price has reversed from a downtrend to an uptrend. It represents a high concentration of buyers.
Time Frames:
Use higher time frames (like daily or weekly) to identify key supply and demand zones.
Use lower time frames (like 1-hour or 4-hour) to pinpoint precise entry and exit points within these zones.
Confirmation:
Use price action and candlestick patterns (like pin bars or engulfing patterns) to confirm potential reversals in these zones.
オープンソーススクリプト
TradingViewの精神に則り、このスクリプトの作者はコードをオープンソースとして公開してくれました。トレーダーが内容を確認・検証できるようにという配慮です。作者に拍手を送りましょう!無料で利用できますが、コードの再公開はハウスルールに従う必要があります。
免責事項
この情報および投稿は、TradingViewが提供または推奨する金融、投資、トレード、その他のアドバイスや推奨を意図するものではなく、それらを構成するものでもありません。詳細は利用規約をご覧ください。
オープンソーススクリプト
TradingViewの精神に則り、このスクリプトの作者はコードをオープンソースとして公開してくれました。トレーダーが内容を確認・検証できるようにという配慮です。作者に拍手を送りましょう!無料で利用できますが、コードの再公開はハウスルールに従う必要があります。
免責事項
この情報および投稿は、TradingViewが提供または推奨する金融、投資、トレード、その他のアドバイスや推奨を意図するものではなく、それらを構成するものでもありません。詳細は利用規約をご覧ください。