OPEN-SOURCE SCRIPT
更新済 TKP McClellan Summation Index Stochastics Strategy
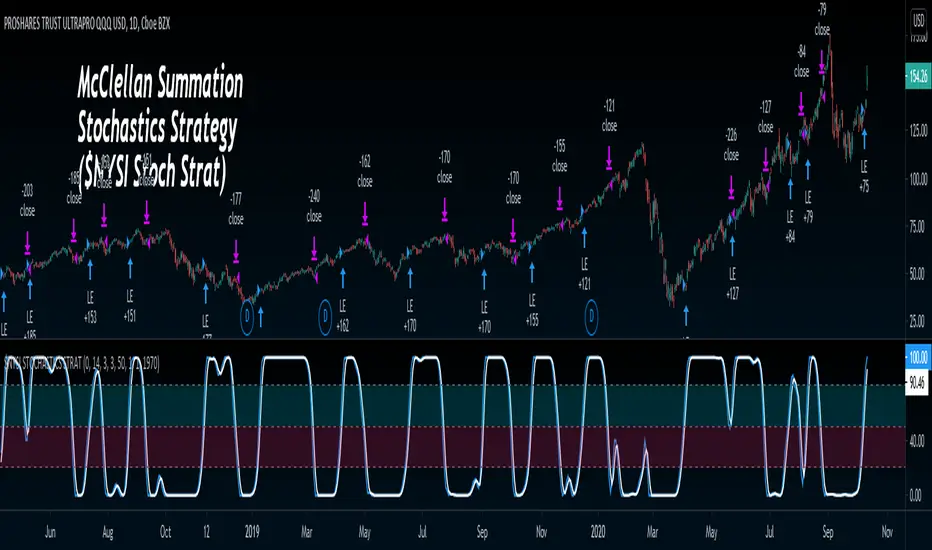
This strategy uses NYSE McClellan summation Index as an input for Stochastics to produce Buy/Sell signals. Buy signal is produced when Stochastics K Line Closes over 50, and Sell signal when closes under 50.
Info on McClellan Summation Index: investopedia.com/terms/m/mcclellansummation.asp
Info on Stochastics: investopedia.com/articles/technical/073001.asp
Simple yet effective strategy, let me know if you have any questions!
Info on McClellan Summation Index: investopedia.com/terms/m/mcclellansummation.asp
Info on Stochastics: investopedia.com/articles/technical/073001.asp
Simple yet effective strategy, let me know if you have any questions!
リリースノート
I've added two things in this update. 1. Time stamp so you can now back-test from a different start date... for example, since 2019, the strategy is 90% profitable on $TQQQ.
2. I added the ability to change the threshold on Buy/Sell crossover level.
オープンソーススクリプト
TradingViewの精神に則り、このスクリプトの作者はコードをオープンソースとして公開してくれました。トレーダーが内容を確認・検証できるようにという配慮です。作者に拍手を送りましょう!無料で利用できますが、コードの再公開はハウスルールに従う必要があります。
免責事項
この情報および投稿は、TradingViewが提供または推奨する金融、投資、トレード、その他のアドバイスや推奨を意図するものではなく、それらを構成するものでもありません。詳細は利用規約をご覧ください。
オープンソーススクリプト
TradingViewの精神に則り、このスクリプトの作者はコードをオープンソースとして公開してくれました。トレーダーが内容を確認・検証できるようにという配慮です。作者に拍手を送りましょう!無料で利用できますが、コードの再公開はハウスルールに従う必要があります。
免責事項
この情報および投稿は、TradingViewが提供または推奨する金融、投資、トレード、その他のアドバイスや推奨を意図するものではなく、それらを構成するものでもありません。詳細は利用規約をご覧ください。