OPEN-SOURCE SCRIPT
Theoretical price by volume
This code is used to calculate a theoretical price range based on volume and price change and display it on the chart. Specifically, it calculates the “theoretical price volatility” based on price changes and volume, from which the upper and lower price limits are derived.
The price volatility is calculated by dividing the price change by the volume as the change unit volume.
Based on this volatility, we calculate the theoretical variation relative to the current price (“Theoretical Variance Difference”).
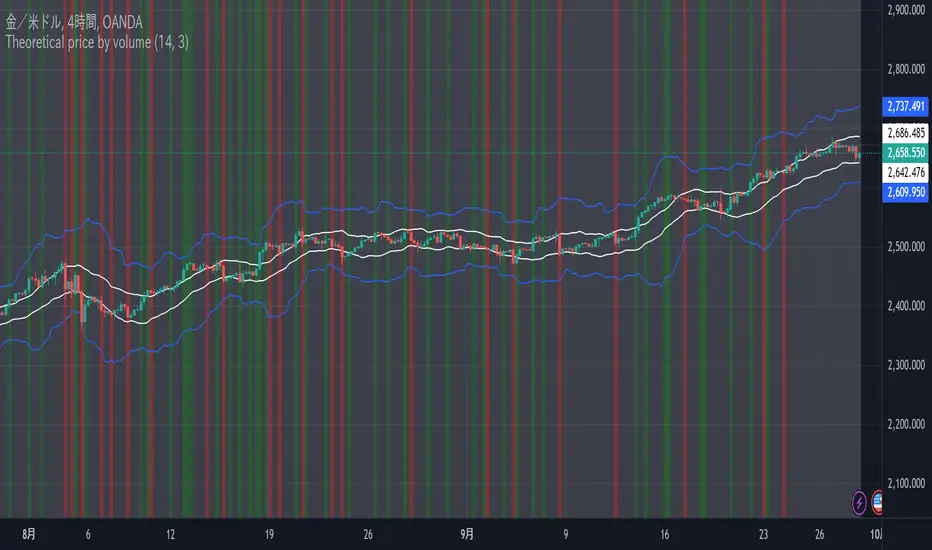
Based on the results, **Theoretical High Price (p_price) and Theoretical Low Price (m_price)** are calculated.
The chart displays the upper and lower bounds of these theoretical prices in color, and also calculates their mean and standard deviation (in the form of a Bollinger band) and plots them.
The background color on the chart indicates whether the price is within the theoretical price range, and at the same time, the mean and standard deviation of the theoretical prices are used to visualize price movements in more detail.
This indicator helps traders understand the impact of volume on price movements and helps them determine if prices are staying within the theoretical range or if there are unusual movements.
The price volatility is calculated by dividing the price change by the volume as the change unit volume.
Based on this volatility, we calculate the theoretical variation relative to the current price (“Theoretical Variance Difference”).
Based on the results, **Theoretical High Price (p_price) and Theoretical Low Price (m_price)** are calculated.
The chart displays the upper and lower bounds of these theoretical prices in color, and also calculates their mean and standard deviation (in the form of a Bollinger band) and plots them.
The background color on the chart indicates whether the price is within the theoretical price range, and at the same time, the mean and standard deviation of the theoretical prices are used to visualize price movements in more detail.
This indicator helps traders understand the impact of volume on price movements and helps them determine if prices are staying within the theoretical range or if there are unusual movements.
オープンソーススクリプト
TradingViewの精神に則り、このスクリプトの作者はコードをオープンソースとして公開してくれました。トレーダーが内容を確認・検証できるようにという配慮です。作者に拍手を送りましょう!無料で利用できますが、コードの再公開はハウスルールに従う必要があります。
免責事項
この情報および投稿は、TradingViewが提供または推奨する金融、投資、トレード、その他のアドバイスや推奨を意図するものではなく、それらを構成するものでもありません。詳細は利用規約をご覧ください。
オープンソーススクリプト
TradingViewの精神に則り、このスクリプトの作者はコードをオープンソースとして公開してくれました。トレーダーが内容を確認・検証できるようにという配慮です。作者に拍手を送りましょう!無料で利用できますが、コードの再公開はハウスルールに従う必要があります。
免責事項
この情報および投稿は、TradingViewが提供または推奨する金融、投資、トレード、その他のアドバイスや推奨を意図するものではなく、それらを構成するものでもありません。詳細は利用規約をご覧ください。