OPEN-SOURCE SCRIPT
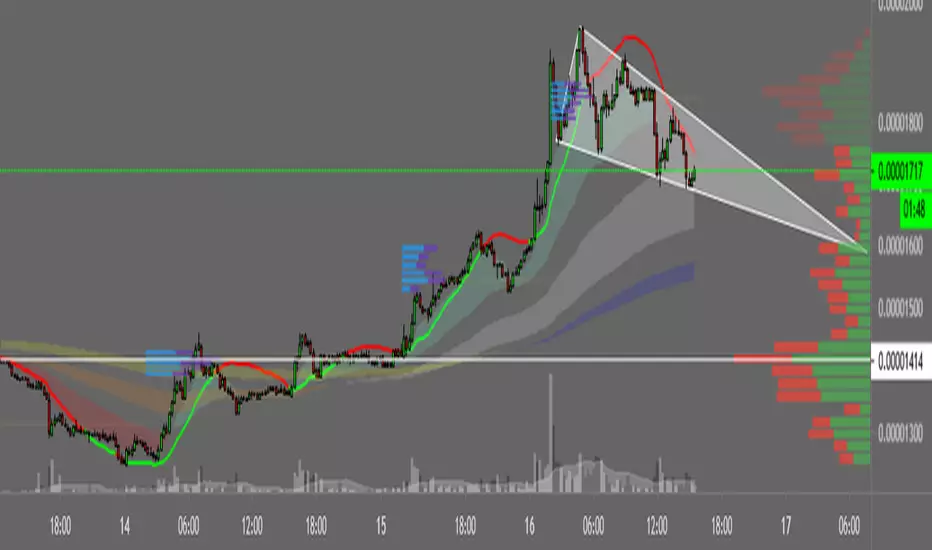
更新済 EMA 9/45/90/180/270/360 Reversals

Hey!
This is a 6EMA crossover script, to make a whole trend and S/R analysis in a second ;)
Hope you like it! Leave a like pls :)
This is a 6EMA crossover script, to make a whole trend and S/R analysis in a second ;)
Hope you like it! Leave a like pls :)
リリースノート
UPDATE:#Change in colours: I think these are kinda better.
#Added SD*3 from de EMA9 (Green plot): Works as a delayed Lower Bollinger Band. My invention :)
TIPS: You can unfill the zones, and give more opacy to EMAs. I cannot untick them, but I can do give them 100% transparency.
Also, you can untick the SD*3 recently added.
Soon more updates :)
リリースノート
UPDATE:#Added Linear Regression and crossover with price colour change. This gives a clear idea of the trend.
Price above LR = Bullish
Price below LR = Bearish
I turned TL1-TD*3 to 100% transparency, but you can turn it on if you liked it.
Leave me suggestions!
Thanks for support.
オープンソーススクリプト
TradingViewの精神に則り、このスクリプトの作者はコードをオープンソースとして公開してくれました。トレーダーが内容を確認・検証できるようにという配慮です。作者に拍手を送りましょう!無料で利用できますが、コードの再公開はハウスルールに従う必要があります。
免責事項
この情報および投稿は、TradingViewが提供または推奨する金融、投資、トレード、その他のアドバイスや推奨を意図するものではなく、それらを構成するものでもありません。詳細は利用規約をご覧ください。
オープンソーススクリプト
TradingViewの精神に則り、このスクリプトの作者はコードをオープンソースとして公開してくれました。トレーダーが内容を確認・検証できるようにという配慮です。作者に拍手を送りましょう!無料で利用できますが、コードの再公開はハウスルールに従う必要があります。
免責事項
この情報および投稿は、TradingViewが提供または推奨する金融、投資、トレード、その他のアドバイスや推奨を意図するものではなく、それらを構成するものでもありません。詳細は利用規約をご覧ください。