OPEN-SOURCE SCRIPT
Buffett Indicator (Wilshire 5000 / GDP)
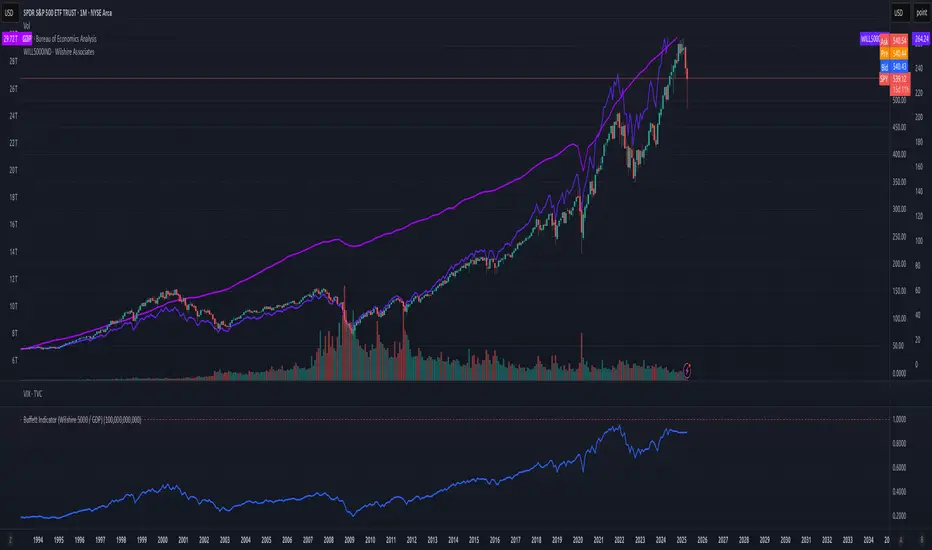
The Buffett Indicator (Wilshire 5000 / GDP) is a macroeconomic metric used to assess whether the U.S. stock market is overvalued or undervalued. It is calculated by dividing the total market capitalization (represented by the Wilshire 5000 Index) by the U.S. Gross Domestic Product (GDP). A value above 1 (or 100%) may indicate an overvalued market, while a value below 1 suggests potential undervaluation. This indicator is best suited for long-term investment analysis.
オープンソーススクリプト
TradingViewの精神に則り、このスクリプトの作者はコードをオープンソースとして公開してくれました。トレーダーが内容を確認・検証できるようにという配慮です。作者に拍手を送りましょう!無料で利用できますが、コードの再公開はハウスルールに従う必要があります。
免責事項
この情報および投稿は、TradingViewが提供または推奨する金融、投資、トレード、その他のアドバイスや推奨を意図するものではなく、それらを構成するものでもありません。詳細は利用規約をご覧ください。
オープンソーススクリプト
TradingViewの精神に則り、このスクリプトの作者はコードをオープンソースとして公開してくれました。トレーダーが内容を確認・検証できるようにという配慮です。作者に拍手を送りましょう!無料で利用できますが、コードの再公開はハウスルールに従う必要があります。
免責事項
この情報および投稿は、TradingViewが提供または推奨する金融、投資、トレード、その他のアドバイスや推奨を意図するものではなく、それらを構成するものでもありません。詳細は利用規約をご覧ください。