OPEN-SOURCE SCRIPT
更新済 Daily High Low Movement
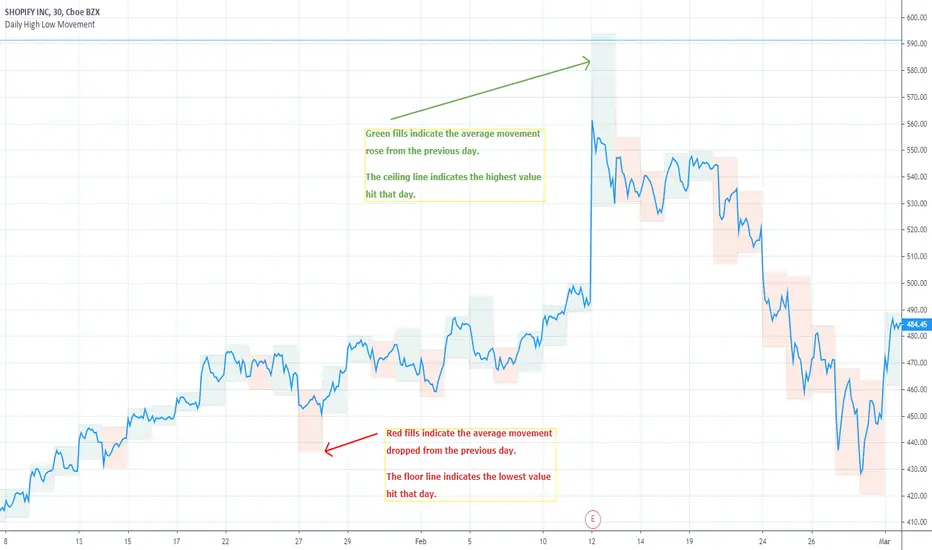
Indicates the daily high and low drawn by green and red lines. Fill blocks indicate the average value movement relevant to the previous day. Green fills indicate that the value is moving higher than the previous day and red meaning lower.
 BA
BA
リリースノート
Updating the comment for an example of use.リリースノート
This capture example shows how to use it for a trailing stop loss. You'll want to never intersect the blocks because the blocks indicate the daily volatility range.リリースノート
Updated example chart.Increased opacity of default fills.
リリースノート
Updated chart example.オープンソーススクリプト
TradingViewの精神に則り、このスクリプトの作者はコードをオープンソースとして公開してくれました。トレーダーが内容を確認・検証できるようにという配慮です。作者に拍手を送りましょう!無料で利用できますが、コードの再公開はハウスルールに従う必要があります。
免責事項
この情報および投稿は、TradingViewが提供または推奨する金融、投資、トレード、その他のアドバイスや推奨を意図するものではなく、それらを構成するものでもありません。詳細は利用規約をご覧ください。
オープンソーススクリプト
TradingViewの精神に則り、このスクリプトの作者はコードをオープンソースとして公開してくれました。トレーダーが内容を確認・検証できるようにという配慮です。作者に拍手を送りましょう!無料で利用できますが、コードの再公開はハウスルールに従う必要があります。
免責事項
この情報および投稿は、TradingViewが提供または推奨する金融、投資、トレード、その他のアドバイスや推奨を意図するものではなく、それらを構成するものでもありません。詳細は利用規約をご覧ください。