OPEN-SOURCE SCRIPT
更新済 Market Profile Fixed View

Some instruments does not provide any volume information, therefore, as a fixed volume profile user, I needed a fixed market profile indicator to use the same principles, regardless of whether the volumes are available or not.
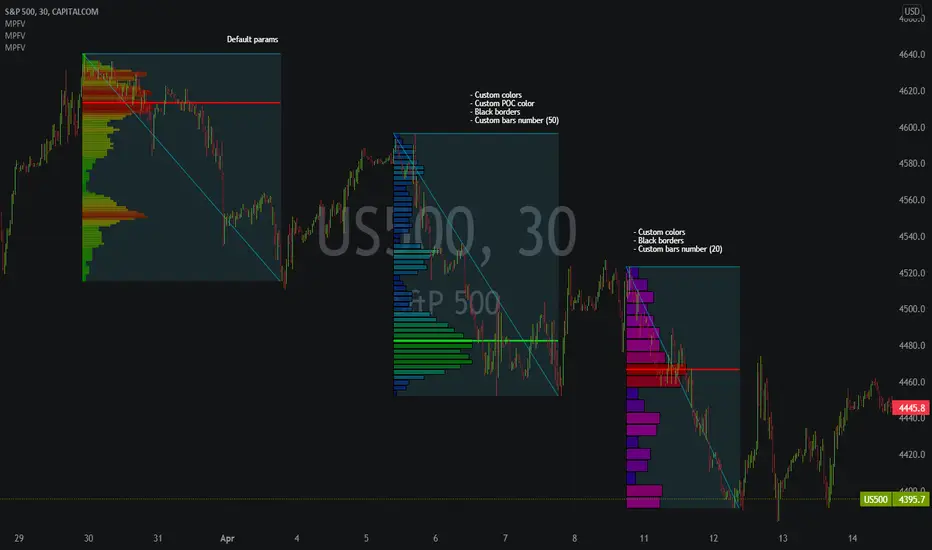
This script draws a market profile histogram corresponding to price variations within a specific duration, you only need to specify Start and End date/time values to see the histogram on your chart.
Details
Options
* Start calculation
* End calculation
* Bars number (histogram resolution, currently locked to a max value of 50 bars)
* Display side/Width (allows to modify size of bars, to the left or to the right)
* Bars/Borders/POC Color customization
Notes
This script draws a market profile histogram corresponding to price variations within a specific duration, you only need to specify Start and End date/time values to see the histogram on your chart.
Details
- Two lines corresponding to highest/lowest prices are displayed around the histogram
- The redline corresponds to the POC (point of control)
Options
* Start calculation
* End calculation
* Bars number (histogram resolution, currently locked to a max value of 50 bars)
* Display side/Width (allows to modify size of bars, to the left or to the right)
* Bars/Borders/POC Color customization
Notes
- This script will probably be updated (to add VAH/VAL zones, and maybe other options). However, some common market profile attributes have not been implemented yet since I don't really use them)
リリースノート
New update with some new options- You can now use 200 bars within a market profile area
- A Heat color feature has been added with customization params
- A background color can be added to the MP area (enabled by default)
リリースノート
Update:the POC line can be extended to the right (disabled by default)
リリースノート
Update:Lowest price line fixed
リリースノート
Updates:- You can now enable/disable histogram, POC, high/low lines and background
オープンソーススクリプト
TradingViewの精神に則り、このスクリプトの作者はコードをオープンソースとして公開してくれました。トレーダーが内容を確認・検証できるようにという配慮です。作者に拍手を送りましょう!無料で利用できますが、コードの再公開はハウスルールに従う必要があります。
免責事項
この情報および投稿は、TradingViewが提供または推奨する金融、投資、トレード、その他のアドバイスや推奨を意図するものではなく、それらを構成するものでもありません。詳細は利用規約をご覧ください。
オープンソーススクリプト
TradingViewの精神に則り、このスクリプトの作者はコードをオープンソースとして公開してくれました。トレーダーが内容を確認・検証できるようにという配慮です。作者に拍手を送りましょう!無料で利用できますが、コードの再公開はハウスルールに従う必要があります。
免責事項
この情報および投稿は、TradingViewが提供または推奨する金融、投資、トレード、その他のアドバイスや推奨を意図するものではなく、それらを構成するものでもありません。詳細は利用規約をご覧ください。