OPEN-SOURCE SCRIPT
更新済 Quantum Flow Tracker
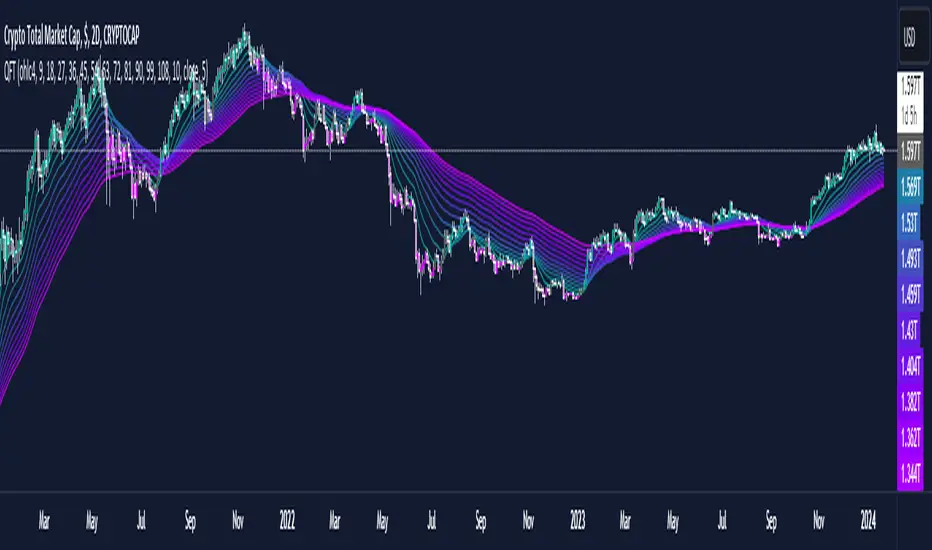
This indicator is designed to capture trends in financial markets by utilizing an Exponential Moving Average (EMA) and the Relative Strength Index (RSI).
Multiple EMAs
The indicator plots multiple EMAs with varying lengths on the chart. Users can customize the lengths of these EMAs using the input parameters.
RSI (Relative Strength Index)
The RSI is calculated based on user-defined length and source inputs.
Additionally, the RSI is smoothed using an Exponential Moving Average (EMA) with a customizable length.
Trend Conditions
The indicator defines uptrend and downtrend conditions based on the relationship between the closing price, the first EMA and the EMA of RSI .
An uptrend (Green Color) is identified when the closing price is above ema1 and the smoothed RSI is above 50.
A downtrend (Purple Color) is identified when the closing price is below ema1 and the smoothed RSI is below 50.
A neutral state (Gray Color) suggests that the trend may be weakening, potentially indicating a forthcoming trend reversal or a period of indecision in the market.
This indicator provides a visual representation of trend directions and can be customized to adjust the sensitivity and frequency of trend changes.
Disclaimer: This indicator is provided for educational and informational purposes only.
It is not intended as financial advice or as a tool for making financial decisions.
Users are advised to conduct their own research and seek the advice of a qualified financial professional before making any investment decisions. The creator of this indicator is not responsible for any financial losses incurred as a result of using this indicator.
リリースノート
Default values for the EMAs error changed.オープンソーススクリプト
TradingViewの精神に則り、このスクリプトの作者はコードをオープンソースとして公開してくれました。トレーダーが内容を確認・検証できるようにという配慮です。作者に拍手を送りましょう!無料で利用できますが、コードの再公開はハウスルールに従う必要があります。
🔍 Access Investing Strategies & Indicators
📊 whop.com/marktquant
🌐 marktquant.com
Nothing shared on this page constitutes financial advice. All information, tools, and analyses are provided solely for informational and educational purposes.
📊 whop.com/marktquant
🌐 marktquant.com
Nothing shared on this page constitutes financial advice. All information, tools, and analyses are provided solely for informational and educational purposes.
免責事項
この情報および投稿は、TradingViewが提供または推奨する金融、投資、トレード、その他のアドバイスや推奨を意図するものではなく、それらを構成するものでもありません。詳細は利用規約をご覧ください。
オープンソーススクリプト
TradingViewの精神に則り、このスクリプトの作者はコードをオープンソースとして公開してくれました。トレーダーが内容を確認・検証できるようにという配慮です。作者に拍手を送りましょう!無料で利用できますが、コードの再公開はハウスルールに従う必要があります。
🔍 Access Investing Strategies & Indicators
📊 whop.com/marktquant
🌐 marktquant.com
Nothing shared on this page constitutes financial advice. All information, tools, and analyses are provided solely for informational and educational purposes.
📊 whop.com/marktquant
🌐 marktquant.com
Nothing shared on this page constitutes financial advice. All information, tools, and analyses are provided solely for informational and educational purposes.
免責事項
この情報および投稿は、TradingViewが提供または推奨する金融、投資、トレード、その他のアドバイスや推奨を意図するものではなく、それらを構成するものでもありません。詳細は利用規約をご覧ください。