OPEN-SOURCE SCRIPT
Trend-Filter [John Ehlers]
Indicator Description — Trend-Filter [John Ehlers]
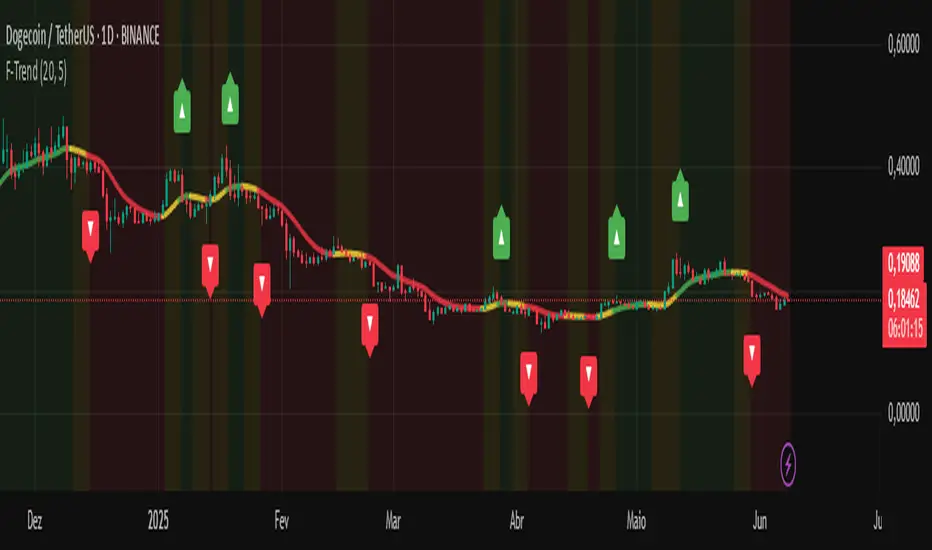
This indicator uses the SuperSmoother filter, created by John Ehlers, to smooth price data and identify trends with greater accuracy and less noise. It counts the number of consecutive bars in uptrend or downtrend to measure the strength of the movement and changes the line and background colors for easy visualization.
How to use this indicator:
SuperSmoother filter: smooths the price to reveal a clearer trend direction by filtering out fast oscillations and market noise.
Bar counting: monitors sequences of bars maintaining an up or down trend to identify consistent moves.
Dynamic colors:
Green line indicates a strong uptrend.
Red line indicates a strong downtrend.
Yellow line shows a neutral or undefined trend.
Optional colored background visually reinforces trend strength with transparency so it does not interfere with price reading.
Visual signals: arrows appear on the chart to mark the start of a strong trend, helping entry or exit decisions.
Adjustable parameters:
SuperSmoother Length: controls the filter smoothing (higher = smoother, less noise).
Trend Threshold: minimum number of consecutive bars to consider a strong trend.
Smooth colors: enable or disable line color smoothing.
Show signals: toggle trend start arrows on/off.
Show dynamic background: toggle the colored background indicating trend strength.
Recommendations:
Use alongside other technical analysis tools and risk management.
Can be applied on any timeframe, but interpretation is more reliable on charts with reasonable data volume.
Ideal for traders seeking to identify consistent trends and avoid market noise.
オープンソーススクリプト
TradingViewの精神に則り、このスクリプトの作者はコードをオープンソースとして公開してくれました。トレーダーが内容を確認・検証できるようにという配慮です。作者に拍手を送りましょう!無料で利用できますが、コードの再公開はハウスルールに従う必要があります。
免責事項
この情報および投稿は、TradingViewが提供または推奨する金融、投資、トレード、その他のアドバイスや推奨を意図するものではなく、それらを構成するものでもありません。詳細は利用規約をご覧ください。
オープンソーススクリプト
TradingViewの精神に則り、このスクリプトの作者はコードをオープンソースとして公開してくれました。トレーダーが内容を確認・検証できるようにという配慮です。作者に拍手を送りましょう!無料で利用できますが、コードの再公開はハウスルールに従う必要があります。
免責事項
この情報および投稿は、TradingViewが提供または推奨する金融、投資、トレード、その他のアドバイスや推奨を意図するものではなく、それらを構成するものでもありません。詳細は利用規約をご覧ください。