OPEN-SOURCE SCRIPT
SwRp – HTF Candle Box Overlay
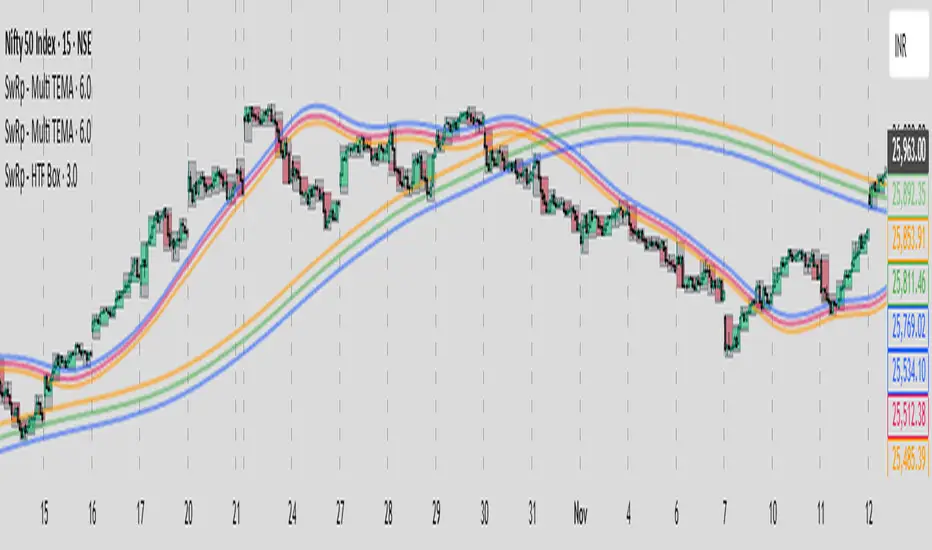
SwRp – HTF Candle Box Overlay gives you a clear visual map of higher-timeframe candles directly on your lower-timeframe chart. Instead of switching timeframes, you can see the structure of each HTF candle plotted as colored boxes that update in real time as the candle forms.
Each HTF candle is drawn using two elements:
• A wick box showing the full high-to-low range
• A body box showing the open-to-close move with automatic bull/bear coloring
Both boxes follow the exact HTF open, high, low and close values, and they stay correctly anchored to price using bar-time positioning. You can customize opacity, body/wick visibility, border color, and the number of HTF candles to keep on the chart. The indicator automatically removes older candles when they exceed your set limit, so the chart stays clean.
This tool is ideal for traders who want to see HTF structure, zones, and candle behavior while analyzing entries and exits on smaller timeframes.
Key Features
• Overlay higher-timeframe candles on lower-timeframe charts
• Real-time updating of HTF candle body and wick
• Bull/bear body coloring with full opacity controls
• Independent toggles for body and wick fills
• Automatically remove older HTF candles to keep the chart clean
• Accurate price anchoring using bar-time for all boxes
• No extra lines, labels, or clutter — a clean visual multi-timeframe view
This indicator offers a simple, clear way to track the behavior of higher-timeframe candles without leaving your current chart, helping you combine HTF context with LTF execution more effectively.
オープンソーススクリプト
TradingViewの精神に則り、このスクリプトの作者はコードをオープンソースとして公開してくれました。トレーダーが内容を確認・検証できるようにという配慮です。作者に拍手を送りましょう!無料で利用できますが、コードの再公開はハウスルールに従う必要があります。
免責事項
この情報および投稿は、TradingViewが提供または推奨する金融、投資、トレード、その他のアドバイスや推奨を意図するものではなく、それらを構成するものでもありません。詳細は利用規約をご覧ください。
オープンソーススクリプト
TradingViewの精神に則り、このスクリプトの作者はコードをオープンソースとして公開してくれました。トレーダーが内容を確認・検証できるようにという配慮です。作者に拍手を送りましょう!無料で利用できますが、コードの再公開はハウスルールに従う必要があります。
免責事項
この情報および投稿は、TradingViewが提供または推奨する金融、投資、トレード、その他のアドバイスや推奨を意図するものではなく、それらを構成するものでもありません。詳細は利用規約をご覧ください。