OPEN-SOURCE SCRIPT
Modified Fractal Open/Close
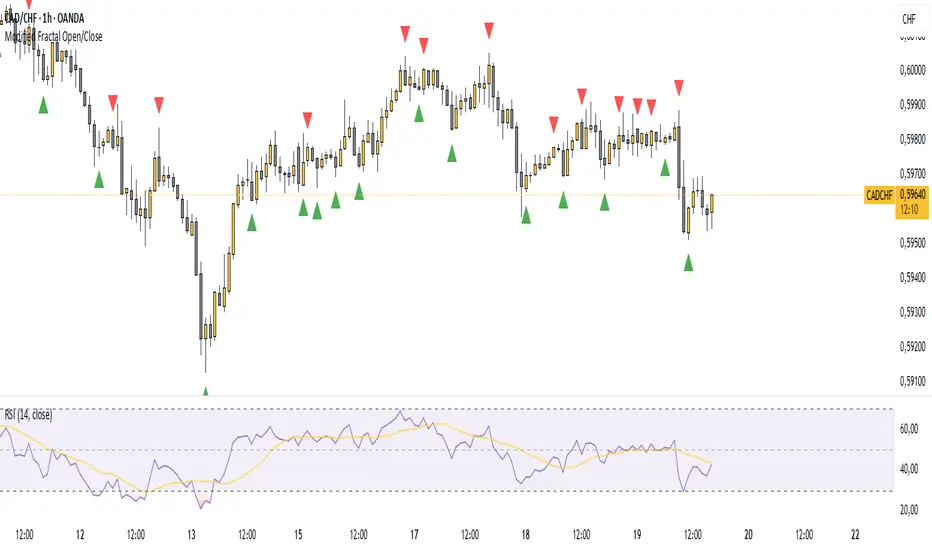
Modified Fractal (Open/Close Based) - Indicator
The Modified Fractal (Open/Close Based) indicator offers a new way to detect fractal patterns on your chart by analyzing the open and close prices instead of the traditional high and low values.
🧮 How it works:
The indicator evaluates a group of 5 consecutive candles.
The central candle (2 bars ago) is analyzed.
For a Bullish Fractal:
The open or close of the central candle must be lower than the open and close of the other 4 surrounding candles.
For a Bearish Fractal:
The open or close of the central candle must be higher than the open and close of the other 4 surrounding candles.
Once a valid pattern is detected, a visual symbol (triangle) is plotted directly on the chart and an alert can be triggered.
✅ Key Features:
Non-repainting signals (evaluated after candle close)
Fully mechanical detection logic
Easy-to-use visual signals
Alert conditions ready to be integrated into TradingView’s alert system
Suitable for multiple timeframes (can be used from M1 to Daily and beyond)
🎯 Use case:
This modified fractal approach can help traders:
Spot potential swing points
Identify possible reversals
Confirm price exhaustion zones
Support breakout or mean reversion strategies
⚠ Note:
This indicator does not provide trade signals by itself. It is recommended to be combined with additional tools, price action analysis, or risk management rules.
オープンソーススクリプト
TradingViewの精神に則り、このスクリプトの作者はコードをオープンソースとして公開してくれました。トレーダーが内容を確認・検証できるようにという配慮です。作者に拍手を送りましょう!無料で利用できますが、コードの再公開はハウスルールに従う必要があります。
免責事項
この情報および投稿は、TradingViewが提供または推奨する金融、投資、トレード、その他のアドバイスや推奨を意図するものではなく、それらを構成するものでもありません。詳細は利用規約をご覧ください。
オープンソーススクリプト
TradingViewの精神に則り、このスクリプトの作者はコードをオープンソースとして公開してくれました。トレーダーが内容を確認・検証できるようにという配慮です。作者に拍手を送りましょう!無料で利用できますが、コードの再公開はハウスルールに従う必要があります。
免責事項
この情報および投稿は、TradingViewが提供または推奨する金融、投資、トレード、その他のアドバイスや推奨を意図するものではなく、それらを構成するものでもありません。詳細は利用規約をご覧ください。