OPEN-SOURCE SCRIPT
CVD with Trend Line
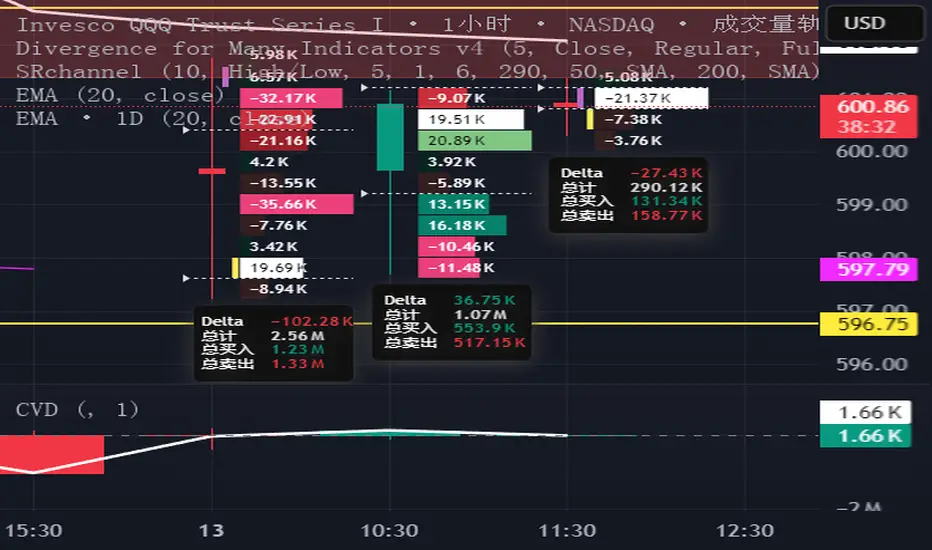
This indicator augments the traditional Cumulative Volume Delta (CVD) by incorporating a customizable trend line that connects the tops of the CVD histogram bars, enhancing visualization of delta trends and market momentum. The CVD measures the net difference between buying and selling volume, utilizing lower timeframe data for accuracy, with configurable anchor periods and timeframe options. The trend line, which can be tailored in both color and style (e.g., solid, dashed), provides traders with a flexible tool to track cumulative delta movements, aiding in the identification of market sentiment shifts. Perfect for volume-based analysis with a clear, adaptable display.
オープンソーススクリプト
TradingViewの精神に則り、このスクリプトの作者はコードをオープンソースとして公開してくれました。トレーダーが内容を確認・検証できるようにという配慮です。作者に拍手を送りましょう!無料で利用できますが、コードの再公開はハウスルールに従う必要があります。
免責事項
この情報および投稿は、TradingViewが提供または推奨する金融、投資、トレード、その他のアドバイスや推奨を意図するものではなく、それらを構成するものでもありません。詳細は利用規約をご覧ください。
オープンソーススクリプト
TradingViewの精神に則り、このスクリプトの作者はコードをオープンソースとして公開してくれました。トレーダーが内容を確認・検証できるようにという配慮です。作者に拍手を送りましょう!無料で利用できますが、コードの再公開はハウスルールに従う必要があります。
免責事項
この情報および投稿は、TradingViewが提供または推奨する金融、投資、トレード、その他のアドバイスや推奨を意図するものではなく、それらを構成するものでもありません。詳細は利用規約をご覧ください。