OPEN-SOURCE SCRIPT
更新済 Volume Pressure
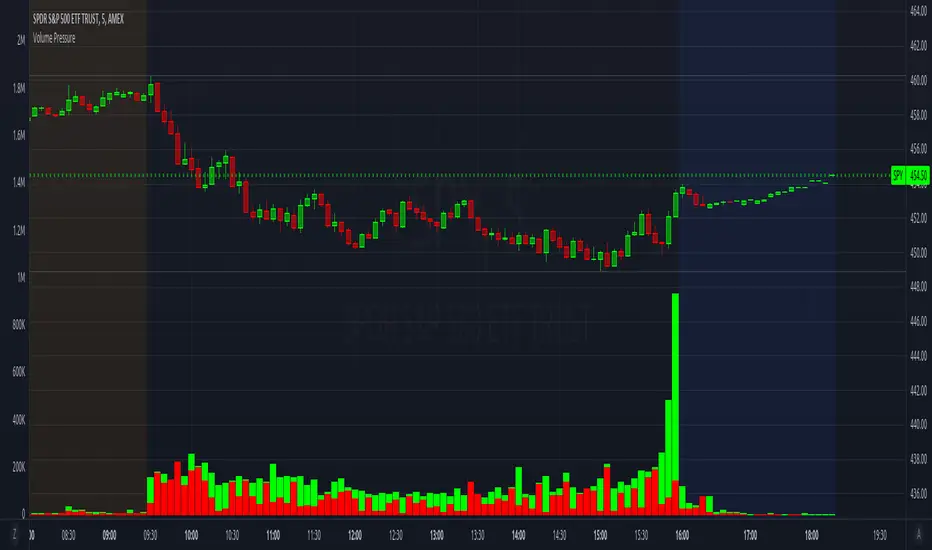
Breaks down volume into buyers (green part) vs sellers (red part).
It is recommended to set the volume's scale, especially if you switch tickers on the same chart. Follow these steps:
To update to the latest version, just close the indicator and add it again.
It is recommended to set the volume's scale, especially if you switch tickers on the same chart. Follow these steps:
- Select the Volume Pressure indicator's 3 dots (...)
- Select Pin To Scale
- Select a separate scale from the main chart, such as Pin To New Left Scale (Z)
- Left click and hold the scale on the side of the chart and drag it up/down to bring the volume bars into the desired area
To update to the latest version, just close the indicator and add it again.
リリースノート
Additional info on the Volume Pressure bars:On a green candle:
- The red part represents the upper wick, the volume as the price comes back down from its high
- The green part represents the rest of the candle, the volume as the price goes up from its low to the close
On a red candle:
- The green part represents the lower wick, the volume as the price comes back up from its low
- The red part represents the rest of the candle, the volume as the price goes down from its high to the close
リリースノート
Added scale property to force it to the left side; this should prevent it from using the chart's main price scale and filling the screenリリースノート
Updated screenshotリリースノート
Fixed problem with volume bars jumping around when switching between tickers. Added a hidden scale line that keeps them relatively consistent.オープンソーススクリプト
TradingViewの精神に則り、このスクリプトの作者はコードをオープンソースとして公開してくれました。トレーダーが内容を確認・検証できるようにという配慮です。作者に拍手を送りましょう!無料で利用できますが、コードの再公開はハウスルールに従う必要があります。
免責事項
この情報および投稿は、TradingViewが提供または推奨する金融、投資、トレード、その他のアドバイスや推奨を意図するものではなく、それらを構成するものでもありません。詳細は利用規約をご覧ください。
オープンソーススクリプト
TradingViewの精神に則り、このスクリプトの作者はコードをオープンソースとして公開してくれました。トレーダーが内容を確認・検証できるようにという配慮です。作者に拍手を送りましょう!無料で利用できますが、コードの再公開はハウスルールに従う必要があります。
免責事項
この情報および投稿は、TradingViewが提供または推奨する金融、投資、トレード、その他のアドバイスや推奨を意図するものではなく、それらを構成するものでもありません。詳細は利用規約をご覧ください。