OPEN-SOURCE SCRIPT
RAHUL ATR + Volume Spikes
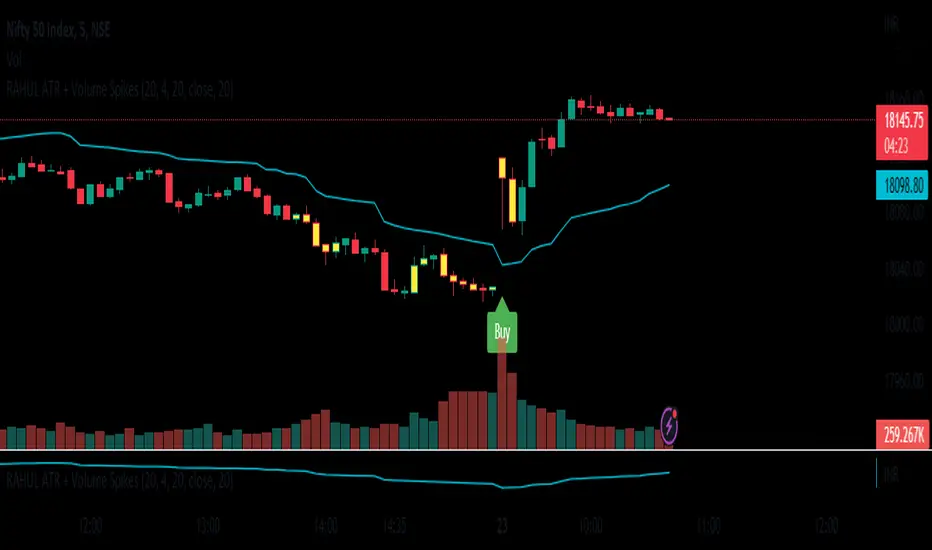
New Volume Spikes Strategy.
The Average True Range (ATR) indicator is a technical analysis tool that measures the volatility of an asset. It can be used to create a trading strategy by identifying periods of high volatility and making trades based on those conditions.
Here is an example of a simple ATR trading strategy:
Calculate the ATR for the asset you are trading. This can typically be done using a charting platform or software.
Identify the average ATR over a period of time (such as 14 days). This will be your "threshold" for determining high volatility.
When the current ATR is above the threshold, enter a long position (buy) in the asset.
When the current ATR is below the threshold, exit the long position (sell) and wait for the next period of high volatility.
Repeat the process for the next period of time.
This is a basic example of an ATR strategy and can be adjusted as per one's preference, you can add other indicators or market conditions to filter out trades and also use different time frame to check the ATR values. ATR can also be used in combination with other indicators and strategies to improve the accuracy of your trades.
It's always important to backtest any strategy before actually trading with real money, and also to consider the risk management, stop loss and profit taking levels, and adjust the strategy accordingly
オープンソーススクリプト
TradingViewの精神に則り、このスクリプトの作者はコードをオープンソースとして公開してくれました。トレーダーが内容を確認・検証できるようにという配慮です。作者に拍手を送りましょう!無料で利用できますが、コードの再公開はハウスルールに従う必要があります。
免責事項
この情報および投稿は、TradingViewが提供または推奨する金融、投資、トレード、その他のアドバイスや推奨を意図するものではなく、それらを構成するものでもありません。詳細は利用規約をご覧ください。
オープンソーススクリプト
TradingViewの精神に則り、このスクリプトの作者はコードをオープンソースとして公開してくれました。トレーダーが内容を確認・検証できるようにという配慮です。作者に拍手を送りましょう!無料で利用できますが、コードの再公開はハウスルールに従う必要があります。
免責事項
この情報および投稿は、TradingViewが提供または推奨する金融、投資、トレード、その他のアドバイスや推奨を意図するものではなく、それらを構成するものでもありません。詳細は利用規約をご覧ください。