OPEN-SOURCE SCRIPT
MACD with divergence signals
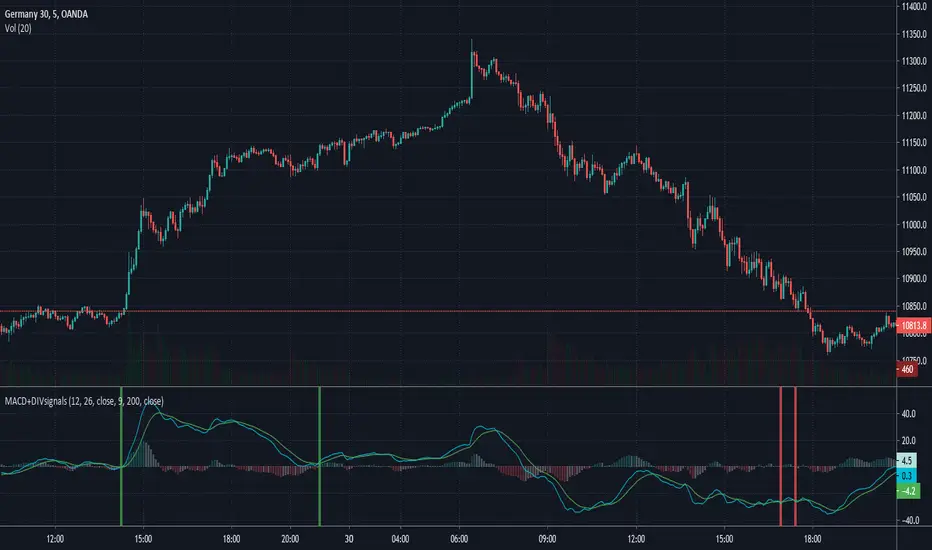
Its an MACD indicator which highlights places where macd and signal line cross and hidden divergence ocures.
Logic behind it is to check if we have hidden divergence when crossing of that two lines and if above EMA200 (signal for BUY - green) or if below EMA200 (signal for SELL - red).
You can change lenght of EMA but i think 200 is a simpliest trend indicator.
Logic behind it is to check if we have hidden divergence when crossing of that two lines and if above EMA200 (signal for BUY - green) or if below EMA200 (signal for SELL - red).
You can change lenght of EMA but i think 200 is a simpliest trend indicator.
オープンソーススクリプト
TradingViewの精神に則り、このスクリプトの作者はコードをオープンソースとして公開してくれました。トレーダーが内容を確認・検証できるようにという配慮です。作者に拍手を送りましょう!無料で利用できますが、コードの再公開はハウスルールに従う必要があります。
免責事項
この情報および投稿は、TradingViewが提供または推奨する金融、投資、トレード、その他のアドバイスや推奨を意図するものではなく、それらを構成するものでもありません。詳細は利用規約をご覧ください。
オープンソーススクリプト
TradingViewの精神に則り、このスクリプトの作者はコードをオープンソースとして公開してくれました。トレーダーが内容を確認・検証できるようにという配慮です。作者に拍手を送りましょう!無料で利用できますが、コードの再公開はハウスルールに従う必要があります。
免責事項
この情報および投稿は、TradingViewが提供または推奨する金融、投資、トレード、その他のアドバイスや推奨を意図するものではなく、それらを構成するものでもありません。詳細は利用規約をご覧ください。