OPEN-SOURCE SCRIPT
Example of Code for Moving Average Cross - Changing Colors
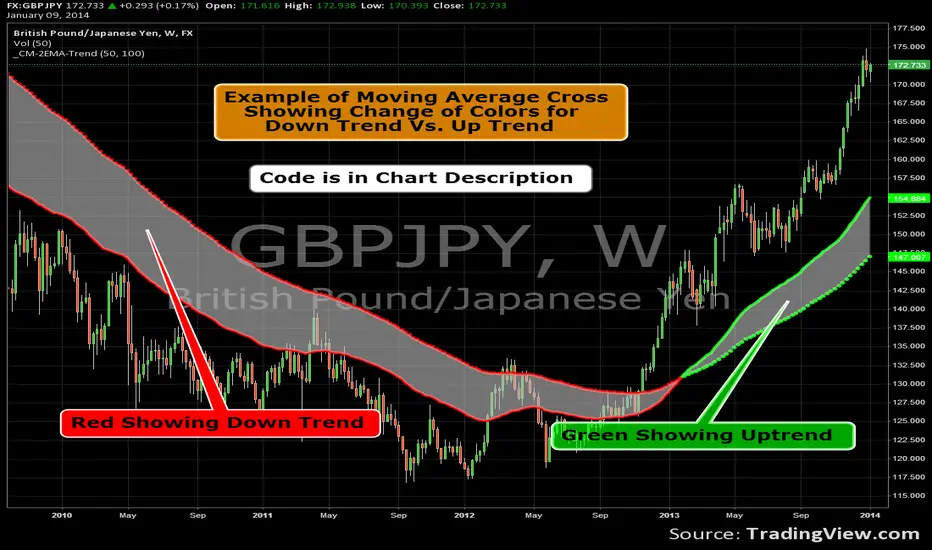
Famous 7 Time World Trading Champion Chuck Hughes found the 50 and 100 EMA to be the best Signal for a Change in Trend. Through extensive back-testing he found these EMA’s to give the earliest signal that also resulted in a Long-Term Change in Trend.
Dotted Line represents Long-Term EMA. The 100 EMA in this example.
Solid line represents the Short-Term EMA. The 50 EMA in this example.
If Short-Term EMA is ABOVE Long-Term EMA...Color = Green.
If Short-Term EMA is BELOW Long-Term EMA...Color = Red.
Dotted Line represents Long-Term EMA. The 100 EMA in this example.
Solid line represents the Short-Term EMA. The 50 EMA in this example.
If Short-Term EMA is ABOVE Long-Term EMA...Color = Green.
If Short-Term EMA is BELOW Long-Term EMA...Color = Red.
オープンソーススクリプト
TradingViewの精神に則り、このスクリプトの作者はコードをオープンソースとして公開してくれました。トレーダーが内容を確認・検証できるようにという配慮です。作者に拍手を送りましょう!無料で利用できますが、コードの再公開はハウスルールに従う必要があります。
Coming Soon: ChrisMoodyTrading.com
免責事項
この情報および投稿は、TradingViewが提供または推奨する金融、投資、トレード、その他のアドバイスや推奨を意図するものではなく、それらを構成するものでもありません。詳細は利用規約をご覧ください。
オープンソーススクリプト
TradingViewの精神に則り、このスクリプトの作者はコードをオープンソースとして公開してくれました。トレーダーが内容を確認・検証できるようにという配慮です。作者に拍手を送りましょう!無料で利用できますが、コードの再公開はハウスルールに従う必要があります。
Coming Soon: ChrisMoodyTrading.com
免責事項
この情報および投稿は、TradingViewが提供または推奨する金融、投資、トレード、その他のアドバイスや推奨を意図するものではなく、それらを構成するものでもありません。詳細は利用規約をご覧ください。