PROTECTED SOURCE SCRIPT
Snapfront Market Clarity Index (MCI) — Lite
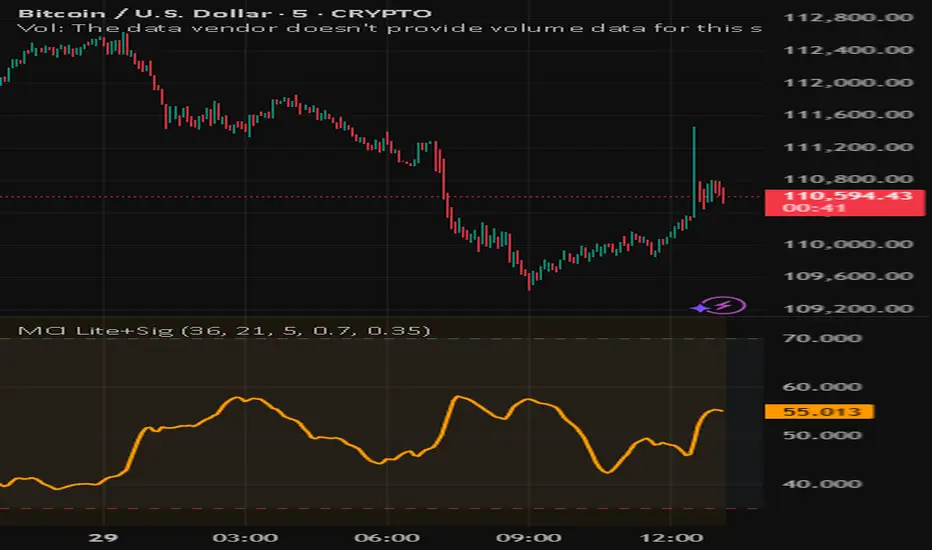
Market Clarity Index (MCI) — Lite + Signals
The Market Clarity Index (MCI) measures trend clarity vs. noise using returns, drift, and volume shock dynamics. Values are normalized through a φ²-based sigmoid for smooth, interpretable signals.
Features:
Clear 0–100 scale (Lite version)
Heatmap background for clarity regimes
Bull/Bear signal arrows with EMA filter
High/Low threshold lines for easy context
Trading Logic:
✅ Bull signal when MCI crosses into the high zone with price above EMA
❌ Bear signal when MCI crosses into the low zone with price below EMA
Use MCI as a trend filter, entry trigger, or market condition gauge across any timeframe or asset.
保護スクリプト
このスクリプトのソースコードは非公開で投稿されています。 ただし、制限なく自由に使用できます – 詳細はこちらでご確認ください。
免責事項
この情報および投稿は、TradingViewが提供または推奨する金融、投資、トレード、その他のアドバイスや推奨を意図するものではなく、それらを構成するものでもありません。詳細は利用規約をご覧ください。
保護スクリプト
このスクリプトのソースコードは非公開で投稿されています。 ただし、制限なく自由に使用できます – 詳細はこちらでご確認ください。
免責事項
この情報および投稿は、TradingViewが提供または推奨する金融、投資、トレード、その他のアドバイスや推奨を意図するものではなく、それらを構成するものでもありません。詳細は利用規約をご覧ください。