OPEN-SOURCE SCRIPT
DZ SR Buy&Sell Enhanced Strategy
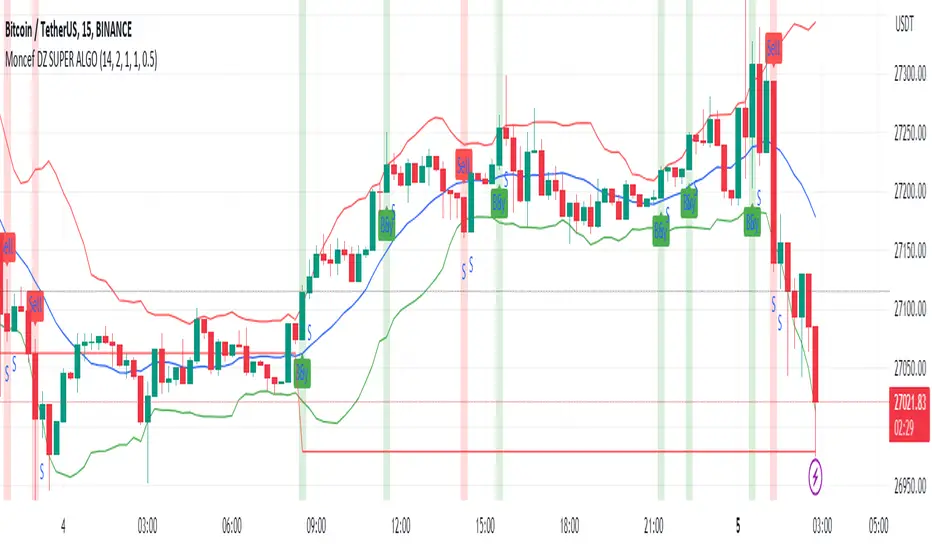
This ALGERIAN indicator titled "SR Buy&Sell with Enhanced Strategy" is designed to identify support and resistance levels on a financial chart, and generates enhanced buy and sell signals based on these levels. It is based on a trading strategy that uses a combination of moving means and standard deviation to calculate support and resistance levels.
The indicator plots support and resistance levels on the chart, with blue color for base level, red for resistance and green for support. Green arrows are displayed when a buy signal is generated, and red arrows when a sell signal is generated.
The market entry strategy is based on breaking support and resistance levels. When a buy signal is generated and no position is opened, a buy position is opened with a take profit and stop loss level calculated according to the parameters set by the user. Similarly, when a sell signal is generated and no position is opened, a sell position is opened with the corresponding take profit and stop loss levels.
The indicator also displays a “STOP” indicator when a position exit signal is generated, indicating to the trader that it is time to close the current position.
This indicator is a powerful tool for traders who want to exploit support and resistance levels to improve their trading decisions. It can be used in different financial markets and different time periods. Parameters such as average moving length, deviations and multiplier can be adjusted according to individual trader preferences.
Note: This indicator only provides potential signals and does not guarantee positive results with every trade. It is recommended to use this indicator in combination with other technical analysis and risk management tools to make informed decisions when trading.
オープンソーススクリプト
TradingViewの精神に則り、このスクリプトの作者はコードをオープンソースとして公開してくれました。トレーダーが内容を確認・検証できるようにという配慮です。作者に拍手を送りましょう!無料で利用できますが、コードの再公開はハウスルールに従う必要があります。
免責事項
この情報および投稿は、TradingViewが提供または推奨する金融、投資、トレード、その他のアドバイスや推奨を意図するものではなく、それらを構成するものでもありません。詳細は利用規約をご覧ください。
オープンソーススクリプト
TradingViewの精神に則り、このスクリプトの作者はコードをオープンソースとして公開してくれました。トレーダーが内容を確認・検証できるようにという配慮です。作者に拍手を送りましょう!無料で利用できますが、コードの再公開はハウスルールに従う必要があります。
免責事項
この情報および投稿は、TradingViewが提供または推奨する金融、投資、トレード、その他のアドバイスや推奨を意図するものではなく、それらを構成するものでもありません。詳細は利用規約をご覧ください。