OPEN-SOURCE SCRIPT
Stock-Index-Relative-Returns
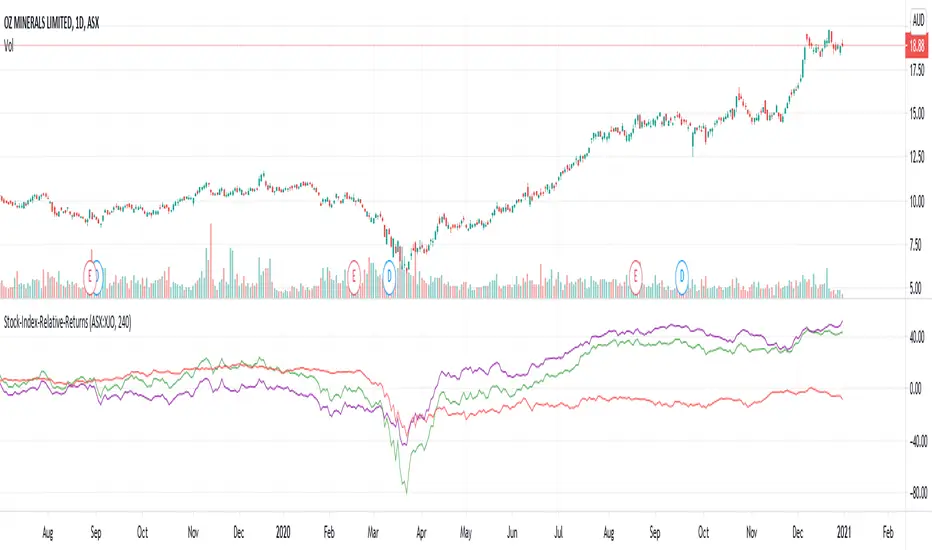
This is one of the entry conditions of Mark Minervini's trend template for entry conditions.
This indicator plots returns in comparison with index. (Change the index ticker in the input as per the stock in use)
Loopback period is the distance from which we are calculating returns.
Green line indicates returns of the stock
Red line indicates returns of the index
Purple line is the difference between both.
Mark Minervini's trend template expects stock_returns/index_returns to be at least 7 - which means at least 70% higher than index returns.
オープンソーススクリプト
TradingViewの精神に則り、このスクリプトの作者はコードをオープンソースとして公開してくれました。トレーダーが内容を確認・検証できるようにという配慮です。作者に拍手を送りましょう!無料で利用できますが、コードの再公開はハウスルールに従う必要があります。
Trial - trendoscope.io/trial
Subscribe - trendoscope.io/pricing
Blog - docs.trendoscope.io
Subscribe - trendoscope.io/pricing
Blog - docs.trendoscope.io
免責事項
この情報および投稿は、TradingViewが提供または推奨する金融、投資、トレード、その他のアドバイスや推奨を意図するものではなく、それらを構成するものでもありません。詳細は利用規約をご覧ください。