OPEN-SOURCE SCRIPT
更新済 Daily Bubble Risk Adjustment

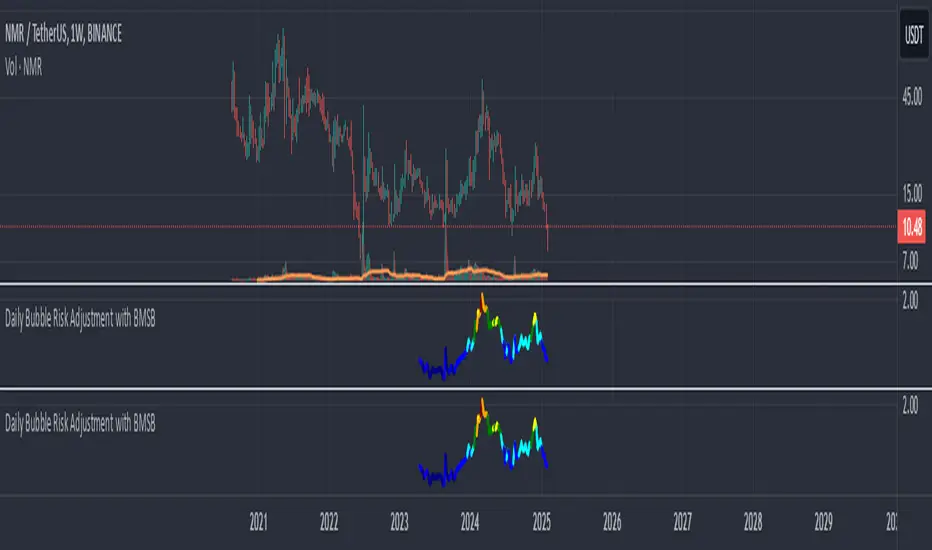
This script calculates the ratio of the asset's closing price to its 20-week moving average (20W MA) and visualizes it as a color-coded line chart. The script also includes a customizable moving average (default: 111-day MA) to help smooth the ratio trend.
It identifies overbought and oversold conditions relative to the 20W MA, making it a valuable tool for long-term trend analysis.
It identifies overbought and oversold conditions relative to the 20W MA, making it a valuable tool for long-term trend analysis.
リリースノート
This script calculates the ratio of the asset's closing price to its 20-week moving average (20W MA) and visualizes it as a color-coded line chart. The script also includes a customizable moving average (default: 111-day MA) to help smooth the ratio trend.It identifies overbought and oversold conditions relative to the 20W MA, making it a valuable tool for long-term trend analysis.
リリースノート
Key Updates:BMSB Implementation:
Added 20-SMA and 21-EMA calculations based on the ratio instead of price.
Introduced a shaded area between the two for better visualization.
Revised Color Assignments:
Adjusted the color gradient for different ratio ranges.
Improved color contrast for better readability.
Divergence Detection:
Implemented regular bullish and bearish divergences using pivot points.
Added labels and markers for easier trend identification.
リリースノート
some adjustments for colorsオープンソーススクリプト
TradingViewの精神に則り、このスクリプトの作者はコードをオープンソースとして公開してくれました。トレーダーが内容を確認・検証できるようにという配慮です。作者に拍手を送りましょう!無料で利用できますが、コードの再公開はハウスルールに従う必要があります。
免責事項
この情報および投稿は、TradingViewが提供または推奨する金融、投資、トレード、その他のアドバイスや推奨を意図するものではなく、それらを構成するものでもありません。詳細は利用規約をご覧ください。
オープンソーススクリプト
TradingViewの精神に則り、このスクリプトの作者はコードをオープンソースとして公開してくれました。トレーダーが内容を確認・検証できるようにという配慮です。作者に拍手を送りましょう!無料で利用できますが、コードの再公開はハウスルールに従う必要があります。
免責事項
この情報および投稿は、TradingViewが提供または推奨する金融、投資、トレード、その他のアドバイスや推奨を意図するものではなく、それらを構成するものでもありません。詳細は利用規約をご覧ください。