OPEN-SOURCE SCRIPT
更新済 Mayer Multiple Dynamic Histogram [arviman]
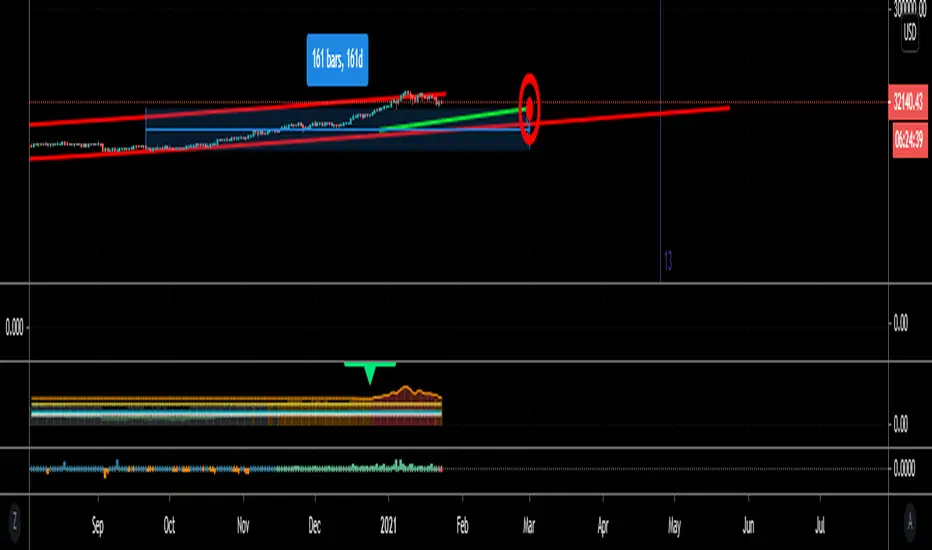
Plots dynamic levels of the standard mayer multiple based on percentile of recent history. This allows you to view color coded information in a more dynamic fashion.
Hope this helps give you an overview of the current market.
This can be used for crypto but also for quick analysis of the current trend for any other instruments like stocks.
Hope this helps give you an overview of the current market.
This can be used for crypto but also for quick analysis of the current trend for any other instruments like stocks.
リリースノート
upgrade to v4, added an SMA displayリリースノート
updated step sizeオープンソーススクリプト
TradingViewの精神に則り、このスクリプトの作者はコードをオープンソースとして公開してくれました。トレーダーが内容を確認・検証できるようにという配慮です。作者に拍手を送りましょう!無料で利用できますが、コードの再公開はハウスルールに従う必要があります。
免責事項
この情報および投稿は、TradingViewが提供または推奨する金融、投資、トレード、その他のアドバイスや推奨を意図するものではなく、それらを構成するものでもありません。詳細は利用規約をご覧ください。
オープンソーススクリプト
TradingViewの精神に則り、このスクリプトの作者はコードをオープンソースとして公開してくれました。トレーダーが内容を確認・検証できるようにという配慮です。作者に拍手を送りましょう!無料で利用できますが、コードの再公開はハウスルールに従う必要があります。
免責事項
この情報および投稿は、TradingViewが提供または推奨する金融、投資、トレード、その他のアドバイスや推奨を意図するものではなく、それらを構成するものでもありません。詳細は利用規約をご覧ください。