OPEN-SOURCE SCRIPT
VWAP Slope

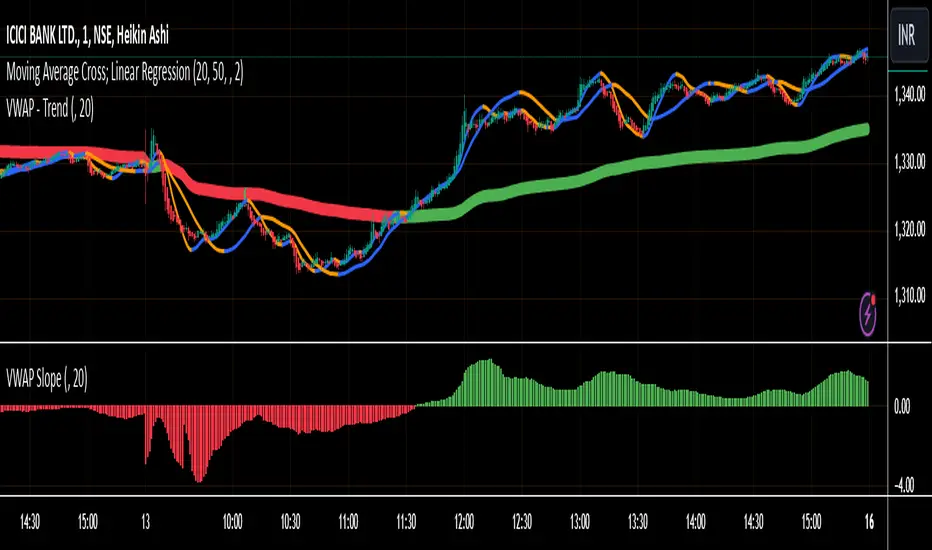
This script calculates and displays the slope of the Volume Weighted Average Price (VWAP). It compares the current VWAP with its value from a user-defined lookback period to determine the slope. The slope is color-coded: green for an upward trend (positive slope) and red for a downward trend (negative slope).
Key Points:
VWAP Calculation: The script calculates the VWAP based on a user-defined timeframe (default: daily), which represents the average price weighted by volume.
Slope Determination: The slope is calculated by comparing the current VWAP to its value from a previous period, providing insight into market trends.
Color-Coding: The slope line is color-coded to visually indicate the market direction: green for uptrend and red for downtrend.
This script helps traders identify the direction of the market based on VWAP, offering a clear view of trends and potential turning points.
オープンソーススクリプト
TradingViewの精神に則り、このスクリプトの作者はコードをオープンソースとして公開してくれました。トレーダーが内容を確認・検証できるようにという配慮です。作者に拍手を送りましょう!無料で利用できますが、コードの再公開はハウスルールに従う必要があります。
免責事項
この情報および投稿は、TradingViewが提供または推奨する金融、投資、トレード、その他のアドバイスや推奨を意図するものではなく、それらを構成するものでもありません。詳細は利用規約をご覧ください。
オープンソーススクリプト
TradingViewの精神に則り、このスクリプトの作者はコードをオープンソースとして公開してくれました。トレーダーが内容を確認・検証できるようにという配慮です。作者に拍手を送りましょう!無料で利用できますが、コードの再公開はハウスルールに従う必要があります。
免責事項
この情報および投稿は、TradingViewが提供または推奨する金融、投資、トレード、その他のアドバイスや推奨を意図するものではなく、それらを構成するものでもありません。詳細は利用規約をご覧ください。