OPEN-SOURCE SCRIPT
Cumulative Delta
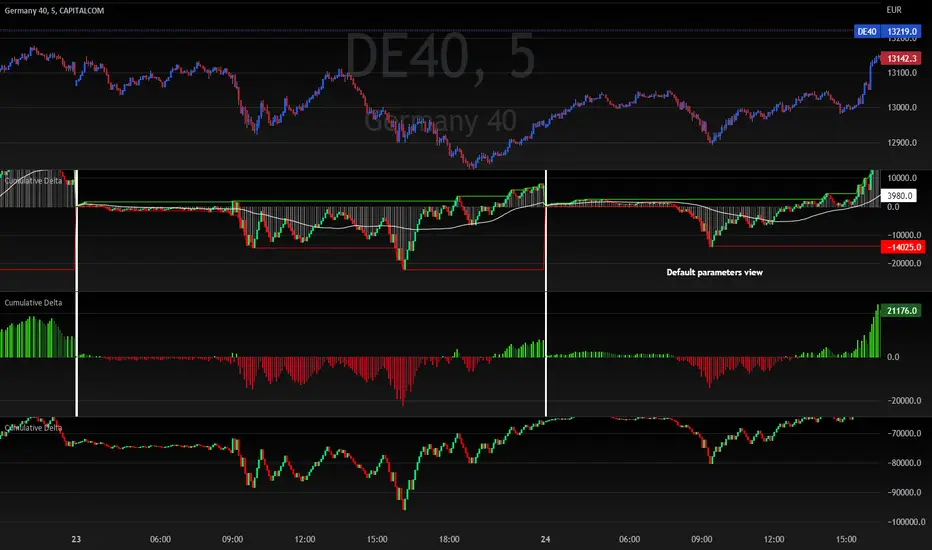
This scripts calculates the cumulative volume delta within the current day.
Options allow you to change the display type of this data (3 different configurations are given in the chart above)
The following options are available:
This script will be updated if I feel the need to improve things or to add new features
Options allow you to change the display type of this data (3 different configurations are given in the chart above)
The following options are available:
- Colors selection
- Reset cumulative delta everyday (can be disable to keep a continuous calculation of the delta over days)
- Show histogram (used to display the delta as a positive/negative histogram)
- Show daily High/Low levels (draw highest and lowest delta levels within the day)
- Show candles (display the cumulative delta as candles)
- Show Moving average (display a moving average which is reseted everyday at the same time as the cumulative delta itself)
- Moving average length
This script will be updated if I feel the need to improve things or to add new features
オープンソーススクリプト
TradingViewの精神に則り、このスクリプトの作者はコードをオープンソースとして公開してくれました。トレーダーが内容を確認・検証できるようにという配慮です。作者に拍手を送りましょう!無料で利用できますが、コードの再公開はハウスルールに従う必要があります。
免責事項
この情報および投稿は、TradingViewが提供または推奨する金融、投資、トレード、その他のアドバイスや推奨を意図するものではなく、それらを構成するものでもありません。詳細は利用規約をご覧ください。
オープンソーススクリプト
TradingViewの精神に則り、このスクリプトの作者はコードをオープンソースとして公開してくれました。トレーダーが内容を確認・検証できるようにという配慮です。作者に拍手を送りましょう!無料で利用できますが、コードの再公開はハウスルールに従う必要があります。
免責事項
この情報および投稿は、TradingViewが提供または推奨する金融、投資、トレード、その他のアドバイスや推奨を意図するものではなく、それらを構成するものでもありません。詳細は利用規約をご覧ください。