OPEN-SOURCE SCRIPT
更新済 Benchmark Relative Performance BRP

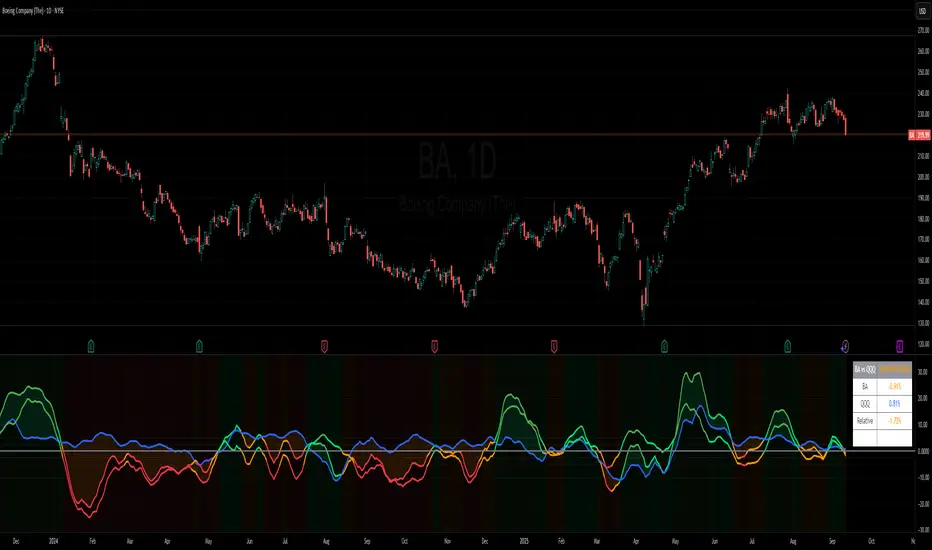
Benchmark Relative Performance (BRP) is a comprehensive technical analysis tool that compares any stock's performance against a chosen benchmark (QQQ, SPY, IWM, etc.) to identify outperformance and underperformance patterns.
Key Features:
Dual-line visualization: Shows both ticker and relative strength performance
Dynamic color coding: 5-level color system indicating performance strength
Customizable benchmark: Choose from any ticker via TradingView's symbol picker
Volume weighting: Optional volume analysis for stronger signal confirmation
Performance zones: Visual thresholds for strong/moderate performance levels
Compact info table: Real-time performance status and values
What It Shows:
Benchmark Performance Line (Blue): Shows your chosen benchmark's percentage performance
Relative Strength Line (Color-coded): Shows how much the ticker outperforms/underperforms
Fill Area: Visual gap between ticker and benchmark performance
Performance Zones: Dotted lines marking significant performance thresholds
Color System:
Green: Strong outperformance (above custom threshold)
Lime: Standard outperformance
Yellow: Neutral/Equal performance
Orange: Standard underperformance
Red: Strong underperformance (below custom threshold)
Best Used For:
Stock selection and rotation strategies
Sector/ETF relative strength analysis
Identifying momentum shifts vs benchmarks
Portfolio performance evaluation
Market timing based on relative performance
Settings:
Customizable lookback period (default: 20)
Adjustable strong performance threshold (default: 5%)
Optional volume weighting factor
Full table customization (position, colors, fonts)
Performance display (percentage or decimal)
Perfect for traders and investors who want to identify stocks showing relative strength or weakness compared to major market benchmarks.
リリースノート
What It DoesThe Relative Performance indicator measures and visualizes how any security performs compared to a chosen benchmark (QQQ, SPY, etc.). It identifies outperformance and underperformance patterns through a multi-tiered classification system with dynamic color coding.
How It Works
Core Calculation Method
The indicator calculates percentage returns over a user-defined period (default: 20 bars):
- Ticker Return = ((Current Close / Close[lookback]) - 1) × 100
- Benchmark Return = ((Benchmark Close / Benchmark Close[lookback]) - 1) × 100
- Relative Strength = Ticker Return - Benchmark Return
All values are smoothed using a 5-period SMA to reduce noise and provide clearer signals.
Optional Volume Weighting
When enabled, the indicator adjusts returns based on relative volume strength, helping identify moves backed by unusual volume activity.
Visual Components
Three Main Lines
- Ticker Performance (Color-coded): Your security's smoothed return
- Benchmark Performance (Blue): Benchmark's smoothed return
- Relative Strength (Multi-colored): Difference between ticker and benchmark
Five-Tier Performance Classification
- Strong Outperform (Green): RS > +5%
- Outperform (Lime): RS > 0%
- Neutral (Yellow): RS ≈ 0%
- Underperform (Orange): RS < 0%
- Strong Underperform (Red): RS < -5%
Additional Features
- Filled area between ticker and benchmark lines
- Horizontal zones marking performance thresholds
- Real-time information table with current values
- Background coloring based on performance status
How to Use It
Primary Applications
- Stock Selection: Find stocks outperforming their sector or market
- Sector Rotation: Compare sector ETFs to identify strength/weakness
- Risk Management: Exit positions showing deteriorating relative strength
- Entry Timing: Confirm breakouts with improving relative strength
Key Signals
Bullish:
- RS line crossing above zero
- Color change to lime/green
- Higher highs in RS during pullbacks
Bearish:
- RS line crossing below zero
- Color change to orange/red
- Lower lows in RS during rallies
Customizable Parameters
Essential Settings
- Benchmark Ticker: Any symbol for comparison (default: QQQ)
- Lookback Period: 1-500 bars for return calculation
- Smoothing Period: 1-50 bars for noise reduction
- Strong Threshold: Define strong performance level (default: 5%)
Advanced Options
- Volume Weight Factor: 0-1 scale for volume influence
- Display Mode: Percentage or decimal view
- Table Settings: Position, size, colors fully customizable
- Color Scheme: Customize all performance level colors
Best Practices
Timeframe Guidelines
- Daily: Best for swing trading (10-20 day lookback)
- Weekly: Position trading and sector rotation (20-50 week lookback)
- Intraday: Day trading strong/weak stocks
Effective Combinations
- Use with moving averages for trend confirmation
- Combine with RSI for overbought/oversold context
- Add volume indicators to confirm RS moves
This indicator uniquely combines percentage-based relative performance with optional volume weighting, five-tier visual classification, and comprehensive dashboard display. The integration of smoothed calculations, dynamic coloring, and performance zones provides a complete relative strength analysis tool not available in standard indicators.
The methodology focuses on normalized percentage returns rather than simple price ratios, making comparisons meaningful across different price scales. The multi-tier classification system instantly identifies not just direction but magnitude of relative performance.
For support or questions, please comment.
リリースノート
Chart symbol/timeframe update.オープンソーススクリプト
TradingViewの精神に則り、このスクリプトの作者はコードをオープンソースとして公開してくれました。トレーダーが内容を確認・検証できるようにという配慮です。作者に拍手を送りましょう!無料で利用できますが、コードの再公開はハウスルールに従う必要があります。
免責事項
この情報および投稿は、TradingViewが提供または推奨する金融、投資、トレード、その他のアドバイスや推奨を意図するものではなく、それらを構成するものでもありません。詳細は利用規約をご覧ください。
オープンソーススクリプト
TradingViewの精神に則り、このスクリプトの作者はコードをオープンソースとして公開してくれました。トレーダーが内容を確認・検証できるようにという配慮です。作者に拍手を送りましょう!無料で利用できますが、コードの再公開はハウスルールに従う必要があります。
免責事項
この情報および投稿は、TradingViewが提供または推奨する金融、投資、トレード、その他のアドバイスや推奨を意図するものではなく、それらを構成するものでもありません。詳細は利用規約をご覧ください。