OPEN-SOURCE SCRIPT
VOLUME DIRECTION INDICATOR
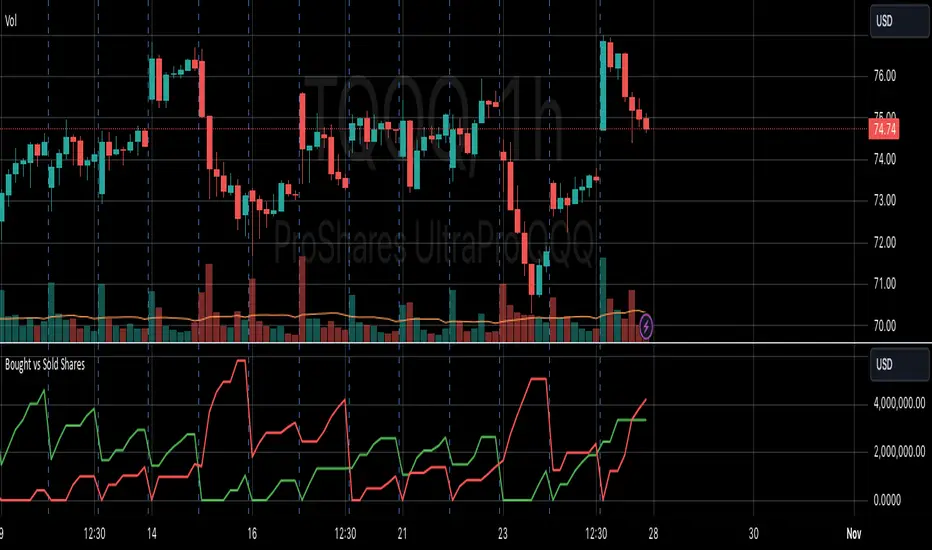
Designed for the 1-hour chart, this indicator shows:
Green Line: Volume when price rises, suggesting buying.
Red Line: Volume when price falls, indicating selling.
How to Use:
Watch for Crossover: When the Green Line moves above the Red, it might signal a budding uptrend.
Check Retracement: If the Green Line pulls back but stays above the Red, the uptrend could be strengthening.
Price Check: Look for a small price drop but not a reversal.
Trade Entry:
Enter at the high of the retracement candle.
Or wait for the Green Line to rise again.
For Precision: Draw a line at the retracement peak and switch to a shorter timeframe to find entry patterns above this line.
Remember: Use this with other tools for better trading decisions.
The Volume Direction Indicator provides a visual representation of market activity by assuming volume can be attributed to buying or selling based on price action within each bar. When the price closes higher than it opened, the volume for that period is considered as 'Bought Shares', plotted in green. Conversely, if the price closes lower, the volume is treated as 'Sold Shares', shown in red. This indicator resets daily to give a fresh perspective on trading activity each day.
Key Features:
Buying Pressure: Green line represents the cumulative volume during periods where the price increased.
Selling Pressure: Red line indicates the cumulative volume during price decreases.
Daily Reset: Accumulated values reset at the start of each new trading day, focusing on daily market sentiment.
Note: This indicator simplifies market dynamics by linking volume directly to price changes. It does not account for complex trading scenarios like short selling or market manipulations. Use this indicator as a tool to gauge general market direction and activity, not for precise transaction data.
オープンソーススクリプト
TradingViewの精神に則り、このスクリプトの作者はコードをオープンソースとして公開してくれました。トレーダーが内容を確認・検証できるようにという配慮です。作者に拍手を送りましょう!無料で利用できますが、コードの再公開はハウスルールに従う必要があります。
免責事項
この情報および投稿は、TradingViewが提供または推奨する金融、投資、トレード、その他のアドバイスや推奨を意図するものではなく、それらを構成するものでもありません。詳細は利用規約をご覧ください。
オープンソーススクリプト
TradingViewの精神に則り、このスクリプトの作者はコードをオープンソースとして公開してくれました。トレーダーが内容を確認・検証できるようにという配慮です。作者に拍手を送りましょう!無料で利用できますが、コードの再公開はハウスルールに従う必要があります。
免責事項
この情報および投稿は、TradingViewが提供または推奨する金融、投資、トレード、その他のアドバイスや推奨を意図するものではなく、それらを構成するものでもありません。詳細は利用規約をご覧ください。