PROTECTED SOURCE SCRIPT
Trend RSI
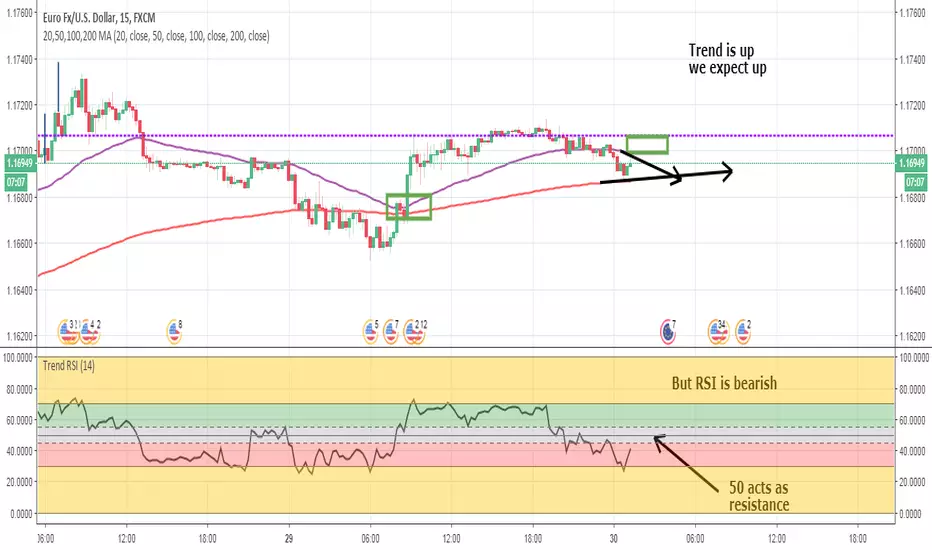
This version of RSI shows the proper levels of how to trade price action.
RSI is more than a reversal tool. It is also a trend following tool.
I've added bands to show Overbought/Oversold.
Above 55 is bullish. Below 45 is bearish.
Do not make any transactions in the 45-55 gray band area.
Coupled with a 50/200 EMA strategy this is more than enough to make a living at trading.
保護スクリプト
このスクリプトのソースコードは非公開で投稿されています。 ただし、制限なく自由に使用できます – 詳細はこちらでご確認ください。
免責事項
この情報および投稿は、TradingViewが提供または推奨する金融、投資、トレード、その他のアドバイスや推奨を意図するものではなく、それらを構成するものでもありません。詳細は利用規約をご覧ください。
免責事項
この情報および投稿は、TradingViewが提供または推奨する金融、投資、トレード、その他のアドバイスや推奨を意図するものではなく、それらを構成するものでもありません。詳細は利用規約をご覧ください。