OPEN-SOURCE SCRIPT
更新済 Greer BuyZone tool

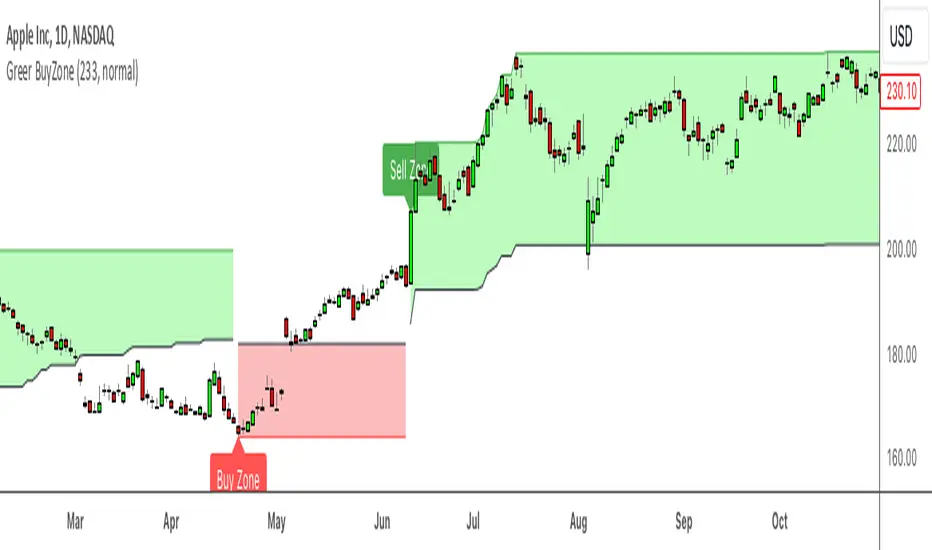
Greer BuyZone Tool
Description:
The Greer BuyZone Tool is a custom Pine Script indicator designed to help identify potential long-term investment opportunities by marking BuyZones on the chart. This tool utilizes the Aroon indicator in combination with Fibonacci numbers to define periods where the asset might be a good candidate for dollar-cost averaging.
Features:
BuyZone Detection: The script identifies and marks the beginning and end of a BuyZone with vertical lines and labels.
Visual Markers: A red vertical line and label indicate the start of a BuyZone, while a green vertical line and label mark the end of a BuyZone.
Aroon Indicator Calculation: Utilizes the Aroon indicator with a Fibonacci length (233) to determine key price levels.
How to Use:
Setup: Add the Greer BuyZone Tool to your TradingView chart. It will display vertical lines and labels marking the BuyZone periods.
BuyZone Identification: Use the red lines and labels ("BZ Begins ->>") to identify the start of a BuyZone, and the green lines and labels ("<<- BZ Ends") to determine when the BuyZone ends.
Long-Term Investment: This tool is intended for long-term investing and dollar-cost averaging strategies, not for day trading.
Disclaimer:
This script is provided for informational purposes only and is not intended as financial advice. The Greer BuyZone Tool is designed to assist in identifying potential long-term investment opportunities and is not suitable for day trading. The use of this tool involves risk, and there is no guarantee of profitability. Users are advised to conduct their own research and consult with a qualified financial advisor before making any investment decisions. The creator of this script assumes no liability for any losses or damages resulting from the use of this indicator.
Author: Sean Lee Greer
Date: 9/1/2024
リリースノート
Release v2 "Clean Up"Cleaning up options so the vertical lines are removed by default but can be added if you like
Also, changed the text size so it's easier to read
リリースノート
// Release Notes 9/29/24 "Adjust the text to display BuyZone Begins below the price bar"// This is make it easier to read
リリースノート
// Release Notes 9/30/24 "Adding Zone Box to make it easier to identify the BuyZone period"// Also, added the option to turn off/on the text label
リリースノート
Update with the correct chartリリースノート
Release Notes:10/3/24: Added alert functionality to notify users when a BuyZone starts or ends. Also refined the script's comments and description for better clarity.
リリースノート
Release Notes:12/17/24: Adjusted the BuyZone Box to only show a red zone (a.k.a BuyZone) for better visualization
Added a green zone to show potential exit points (a.k.a SellZone)
リリースノート
Release Notes: 12/17/24updated chart to clean version
リリースノート
12/17/24: Fixed text from BZ Begins ->> to just BuyZoneオープンソーススクリプト
TradingViewの精神に則り、このスクリプトの作者はコードをオープンソースとして公開してくれました。トレーダーが内容を確認・検証できるようにという配慮です。作者に拍手を送りましょう!無料で利用できますが、コードの再公開はハウスルールに従う必要があります。
免責事項
この情報および投稿は、TradingViewが提供または推奨する金融、投資、トレード、その他のアドバイスや推奨を意図するものではなく、それらを構成するものでもありません。詳細は利用規約をご覧ください。
オープンソーススクリプト
TradingViewの精神に則り、このスクリプトの作者はコードをオープンソースとして公開してくれました。トレーダーが内容を確認・検証できるようにという配慮です。作者に拍手を送りましょう!無料で利用できますが、コードの再公開はハウスルールに従う必要があります。
免責事項
この情報および投稿は、TradingViewが提供または推奨する金融、投資、トレード、その他のアドバイスや推奨を意図するものではなく、それらを構成するものでもありません。詳細は利用規約をご覧ください。