OPEN-SOURCE SCRIPT
更新済 Price Mapper
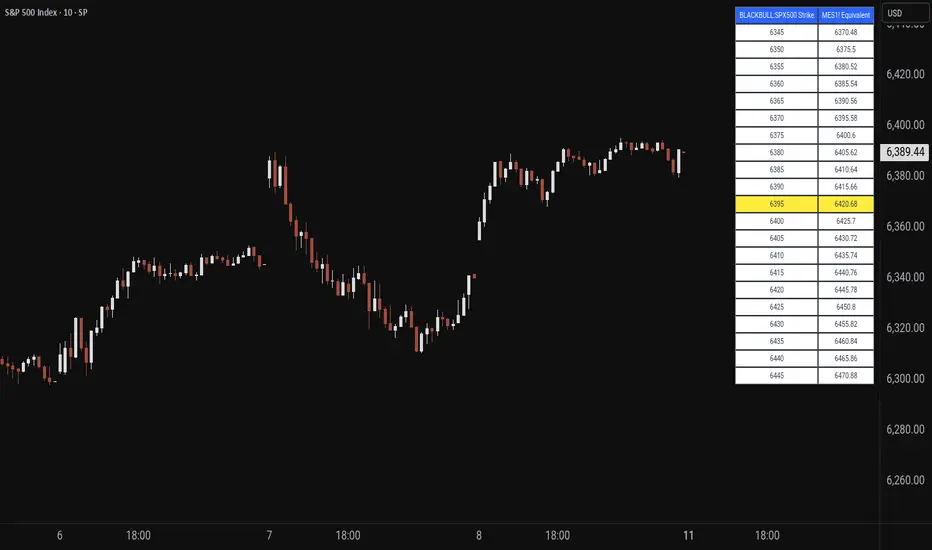
Price Mapper is a dynamic trading tool designed to map strike prices between two related financial instruments using real-time ratio calculations. The indicator displays a customizable table showing strike levels for your primary ticker alongside their equivalent mapped prices for a secondary instrument, making it invaluable for cross-market analysis, pairs trading, and hedging strategies. Whether you're comparing an ETF to its underlying futures, analyzing currency pairs, or exploring relationships between correlated assets, Price Mapper provides instant visual mapping of how price movements in one instrument translate to equivalent levels in another. The ratio calculation updates daily using 12:00 PM New York time closing prices, ensuring consistent reference points while maintaining relevance to current market conditions.
The tool automatically centers around the current market price and allows complete customization of display parameters including strike increments, number of price levels, decimal precision, and table positioning. Advanced color customization options let you highlight the current price level and adjust the appearance to match your trading setup. Price Mapper eliminates the mental math typically required when trading related instruments, instantly showing you equivalent entry and exit levels across different markets. This makes it particularly powerful for options traders working with ETFs and futures, forex traders analyzing currency correlations, or any trader looking to understand precise price relationships between connected financial instruments.
The tool automatically centers around the current market price and allows complete customization of display parameters including strike increments, number of price levels, decimal precision, and table positioning. Advanced color customization options let you highlight the current price level and adjust the appearance to match your trading setup. Price Mapper eliminates the mental math typically required when trading related instruments, instantly showing you equivalent entry and exit levels across different markets. This makes it particularly powerful for options traders working with ETFs and futures, forex traders analyzing currency correlations, or any trader looking to understand precise price relationships between connected financial instruments.
リリースノート
Made presets for GOLD And SP500 but still left the option for any custom tickers as well.リリースノート
updated the picture so its relevant with the indicator again.リリースノート
Added a textsize option in the settingsオープンソーススクリプト
TradingViewの精神に則り、このスクリプトの作者はコードをオープンソースとして公開してくれました。トレーダーが内容を確認・検証できるようにという配慮です。作者に拍手を送りましょう!無料で利用できますが、コードの再公開はハウスルールに従う必要があります。
免責事項
この情報および投稿は、TradingViewが提供または推奨する金融、投資、トレード、その他のアドバイスや推奨を意図するものではなく、それらを構成するものでもありません。詳細は利用規約をご覧ください。
オープンソーススクリプト
TradingViewの精神に則り、このスクリプトの作者はコードをオープンソースとして公開してくれました。トレーダーが内容を確認・検証できるようにという配慮です。作者に拍手を送りましょう!無料で利用できますが、コードの再公開はハウスルールに従う必要があります。
免責事項
この情報および投稿は、TradingViewが提供または推奨する金融、投資、トレード、その他のアドバイスや推奨を意図するものではなく、それらを構成するものでもありません。詳細は利用規約をご覧ください。