OPEN-SOURCE SCRIPT
更新済 Candlestick Trailing Allocation
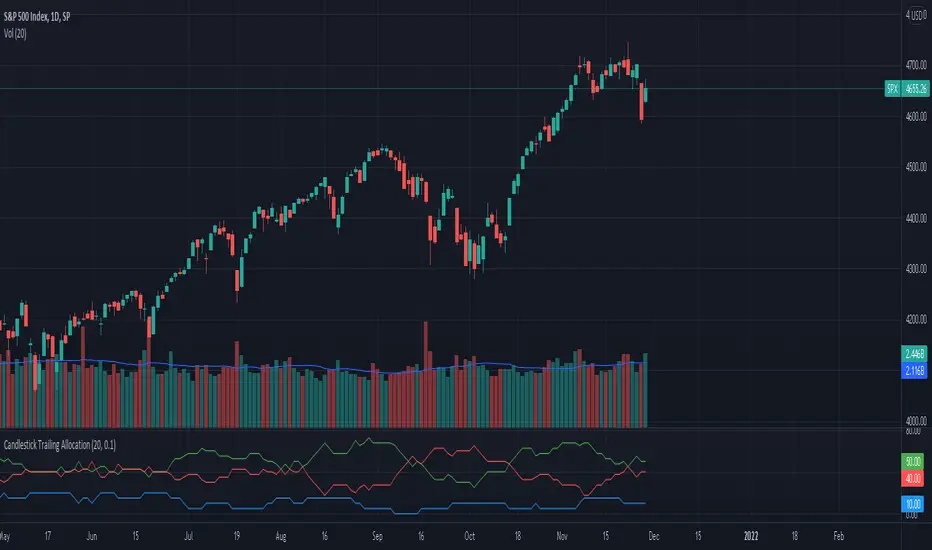
A simple indicator that calculates the sum of 'Up'(green), 'Down'(red), and 'Doji'(near Doji) candlesticks and portrays the same in an allocation format in percentage. And since it is allocation-based, the total will never exceed 100% of the defined Length period.
The equation is Green + Red + Doji = Total Candles; where total candles = length
When calculating the allocation part, the doji candles are subtracted from the sum of green and red, and the new value is divided by the length period.
For example, the green line = (sum of all green candles - doji / 2) / length; the reason to divide doji by 2 is to eliminate the redundancy it can cause.
When the green line crosses above the red line, the number of green candles is more than red in the defined length period. Similarly, when the red line crossed above the green, there were more red candles than green in that period.
The Doji line shows if any doji or near doji candles have appeared. It acts as a form of resistance against the green and red candles.
There's also the option to change the value of the doji's weight. Default is at 0.1.
The indicator does not show trend nor momentum, even though it may replicate some of its behavior from time to time. It is purely showing the allocation of the number of candles classified as green, red, and doji within the length provided.
リリースノート
Truncated the variables used in the source code.オープンソーススクリプト
TradingViewの精神に則り、このスクリプトの作者はコードをオープンソースとして公開してくれました。トレーダーが内容を確認・検証できるようにという配慮です。作者に拍手を送りましょう!無料で利用できますが、コードの再公開はハウスルールに従う必要があります。
免責事項
この情報および投稿は、TradingViewが提供または推奨する金融、投資、トレード、その他のアドバイスや推奨を意図するものではなく、それらを構成するものでもありません。詳細は利用規約をご覧ください。
オープンソーススクリプト
TradingViewの精神に則り、このスクリプトの作者はコードをオープンソースとして公開してくれました。トレーダーが内容を確認・検証できるようにという配慮です。作者に拍手を送りましょう!無料で利用できますが、コードの再公開はハウスルールに従う必要があります。
免責事項
この情報および投稿は、TradingViewが提供または推奨する金融、投資、トレード、その他のアドバイスや推奨を意図するものではなく、それらを構成するものでもありません。詳細は利用規約をご覧ください。