OPEN-SOURCE SCRIPT
更新済 Last xHL
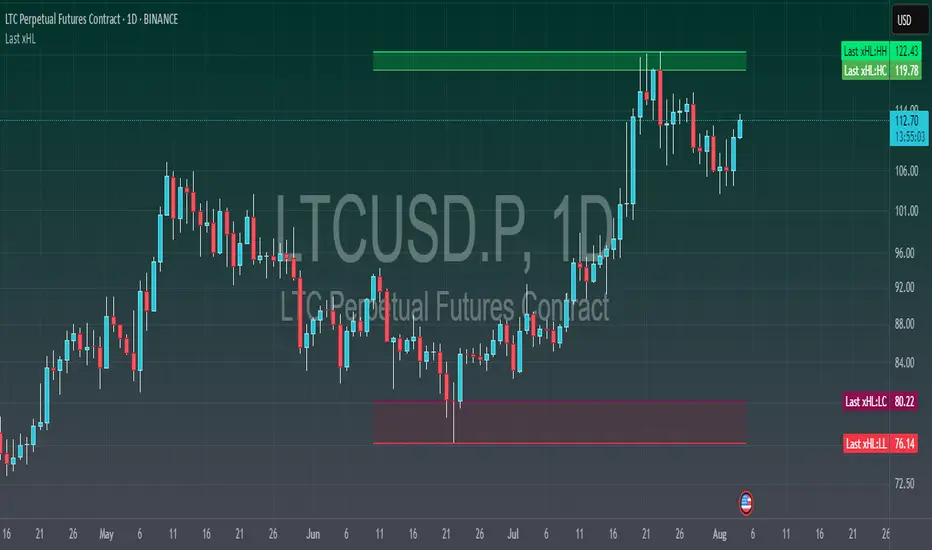
📈 Last xHL – Visualize Key Highs and Lows
This script highlights the most recent significant highs and lows over a user-defined period, helping traders quickly identify key support and resistance zones.
🔍 Features:
⚙️ Customization:
🧠 Use Case:
This tool is ideal for traders who want to:
This script highlights the most recent significant highs and lows over a user-defined period, helping traders quickly identify key support and resistance zones.
🔍 Features:
- Highest High (HH) and Highest Close/Open (HC) lines
- Lowest Low (LL) and Lowest Close/Open (LC) lines
- Dynamic updates with each new bar
- Gradient-filled zones between HH–HC and LL–LC for visual clarity
⚙️ Customization:
- Adjustable lookback period (_length) to suit your trading style
- Color-coded lines and fills for quick interpretation
🧠 Use Case:
This tool is ideal for traders who want to:
- Spot potential breakout or reversal zones
- Identify price compression or expansion areas
- Enhance their technical analysis with visual cues
This script is for educational and informational purposes only. It does not constitute financial advice. Always do your own research before making trading decisions.
リリースノート
✅ New Feature:The values of HH, HC, LL, and LC are now also plotted invisibly to appear in the Data Window and on the Price Scale, allowing for easier reference and analysis without cluttering the chart.
オープンソーススクリプト
TradingViewの精神に則り、このスクリプトの作者はコードをオープンソースとして公開してくれました。トレーダーが内容を確認・検証できるようにという配慮です。作者に拍手を送りましょう!無料で利用できますが、コードの再公開はハウスルールに従う必要があります。
Show your piety to your god. World needs your humanity.
免責事項
この情報および投稿は、TradingViewが提供または推奨する金融、投資、トレード、その他のアドバイスや推奨を意図するものではなく、それらを構成するものでもありません。詳細は利用規約をご覧ください。