OPEN-SOURCE SCRIPT
Circuit % Marker w/ Mirrored Arrows
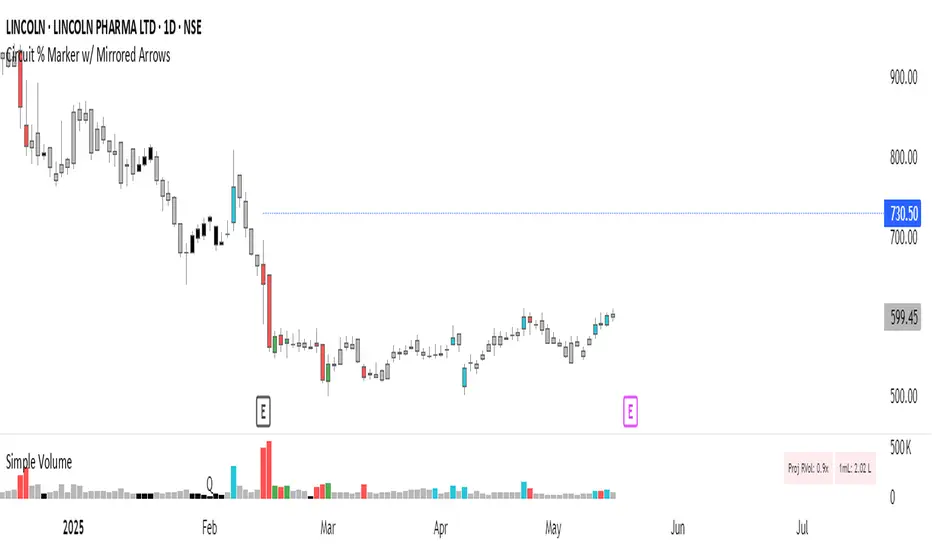
📈 Indian Market Circuit Limit Change Tracker
This indicator automatically tracks circuit limit changes (price bands) as applied in NSE/BSE stocks.
🧠 How It Works:
Start from a user-defined initial circuit limit (e.g. 10%)
If the upper or lower limit is hit, the script waits for a user-defined cooling period (e.g. 5 trading days)
After that, it automatically adjusts to the next lower or higher band (e.g. from 10% to 5%)
Shows a visual label with the current circuit % right on the chart — placed above or below candles for better visibility
🔧 Custom Inputs:
Starting Circuit % — choose between standard NSE/BSE values (20%, 10%, 5%, 2%)
Cooling Days — how many days must pass after a circuit hit before it’s allowed to change again
Label Positioning, Color, and Size — fully customizable to suit your chart style
🚫 No Clutter:
Doesn’t draw circuit limit lines
Just clean, small labels at key turning points — as seen in real trading dashboards
🔍 Notes:
NSE and BSE manually assign circuit bands — this script does not fetch live exchange data
Use it as a visual tracker and simulator of how circuit behavior would evolve under fixed rules
オープンソーススクリプト
TradingViewの精神に則り、このスクリプトの作者はコードをオープンソースとして公開してくれました。トレーダーが内容を確認・検証できるようにという配慮です。作者に拍手を送りましょう!無料で利用できますが、コードの再公開はハウスルールに従う必要があります。
免責事項
この情報および投稿は、TradingViewが提供または推奨する金融、投資、トレード、その他のアドバイスや推奨を意図するものではなく、それらを構成するものでもありません。詳細は利用規約をご覧ください。
オープンソーススクリプト
TradingViewの精神に則り、このスクリプトの作者はコードをオープンソースとして公開してくれました。トレーダーが内容を確認・検証できるようにという配慮です。作者に拍手を送りましょう!無料で利用できますが、コードの再公開はハウスルールに従う必要があります。
免責事項
この情報および投稿は、TradingViewが提供または推奨する金融、投資、トレード、その他のアドバイスや推奨を意図するものではなく、それらを構成するものでもありません。詳細は利用規約をご覧ください。