OPEN-SOURCE SCRIPT
KATIK BankNifty Upside/Downside Levels
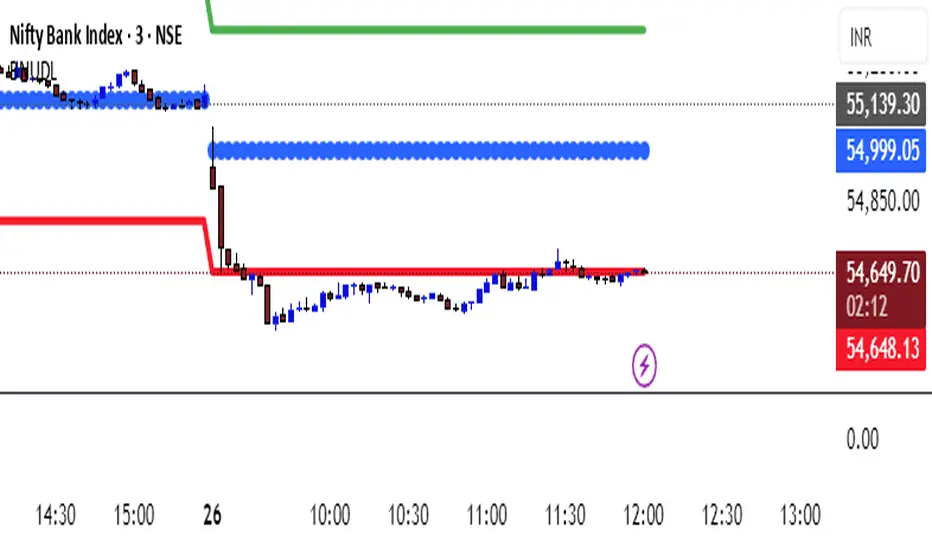
The KATIK BankNifty Upside/Downside Levels (BNUDL) indicator plots key daily reference levels for BankNifty based on its opening price. Using a predefined daily move percentage, it calculates potential upside and downside levels from the open. The script displays:
Up Level (Green): Potential bullish threshold above the open
Down Level (Red): Potential bearish threshold below the open
Open Price (Blue Circles): Daily BankNifty opening level
This tool helps traders quickly identify intraday directional bias and potential support/resistance zones around the opening price.
オープンソーススクリプト
TradingViewの精神に則り、このスクリプトの作者はコードをオープンソースとして公開してくれました。トレーダーが内容を確認・検証できるようにという配慮です。作者に拍手を送りましょう!無料で利用できますが、コードの再公開はハウスルールに従う必要があります。
免責事項
この情報および投稿は、TradingViewが提供または推奨する金融、投資、トレード、その他のアドバイスや推奨を意図するものではなく、それらを構成するものでもありません。詳細は利用規約をご覧ください。
オープンソーススクリプト
TradingViewの精神に則り、このスクリプトの作者はコードをオープンソースとして公開してくれました。トレーダーが内容を確認・検証できるようにという配慮です。作者に拍手を送りましょう!無料で利用できますが、コードの再公開はハウスルールに従う必要があります。
免責事項
この情報および投稿は、TradingViewが提供または推奨する金融、投資、トレード、その他のアドバイスや推奨を意図するものではなく、それらを構成するものでもありません。詳細は利用規約をご覧ください。