OPEN-SOURCE SCRIPT
Trend Length
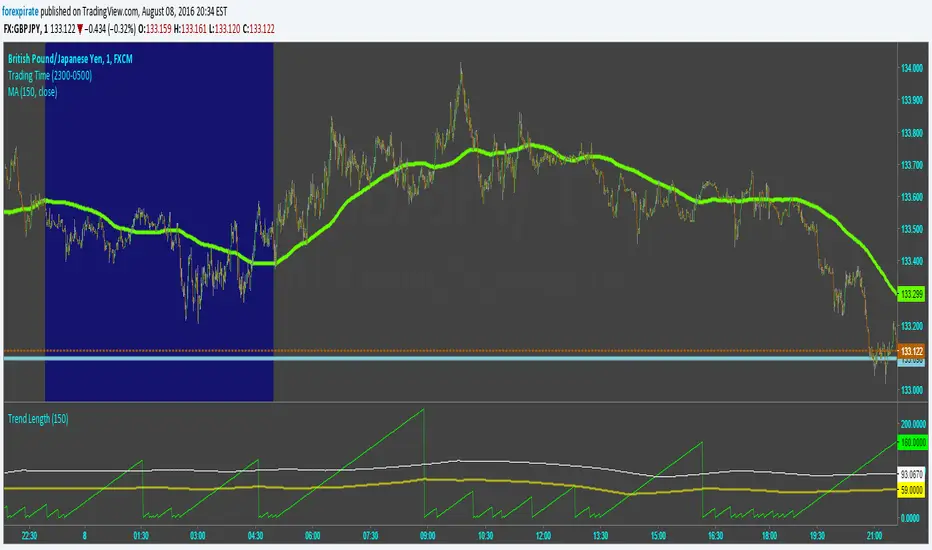
Script tries to capture the length of trends. It calculates an SMA and then determines the slope of the SMA using a simple momentum function. From there it counts bars from when the slope changed directions last. The lime green line is the count from when the slope changed. The yellow line is the average time of a trend. The white line is "trying" to capture the length of a full healthy pip running trend. Pick and SMA you like and then run through many currencies. I find that trends tend to be the same length. Not surprising as the markets are extremely correlated to each other. The trick is to find the most active pair for action. To do that look up my Pairs Range script.
Comments are welcome.
Comments are welcome.
オープンソーススクリプト
TradingViewの精神に則り、このスクリプトの作者はコードをオープンソースとして公開してくれました。トレーダーが内容を確認・検証できるようにという配慮です。作者に拍手を送りましょう!無料で利用できますが、コードの再公開はハウスルールに従う必要があります。
免責事項
この情報および投稿は、TradingViewが提供または推奨する金融、投資、トレード、その他のアドバイスや推奨を意図するものではなく、それらを構成するものでもありません。詳細は利用規約をご覧ください。
オープンソーススクリプト
TradingViewの精神に則り、このスクリプトの作者はコードをオープンソースとして公開してくれました。トレーダーが内容を確認・検証できるようにという配慮です。作者に拍手を送りましょう!無料で利用できますが、コードの再公開はハウスルールに従う必要があります。
免責事項
この情報および投稿は、TradingViewが提供または推奨する金融、投資、トレード、その他のアドバイスや推奨を意図するものではなく、それらを構成するものでもありません。詳細は利用規約をご覧ください。