OPEN-SOURCE SCRIPT
Big 4 EMA Trend Dashboard
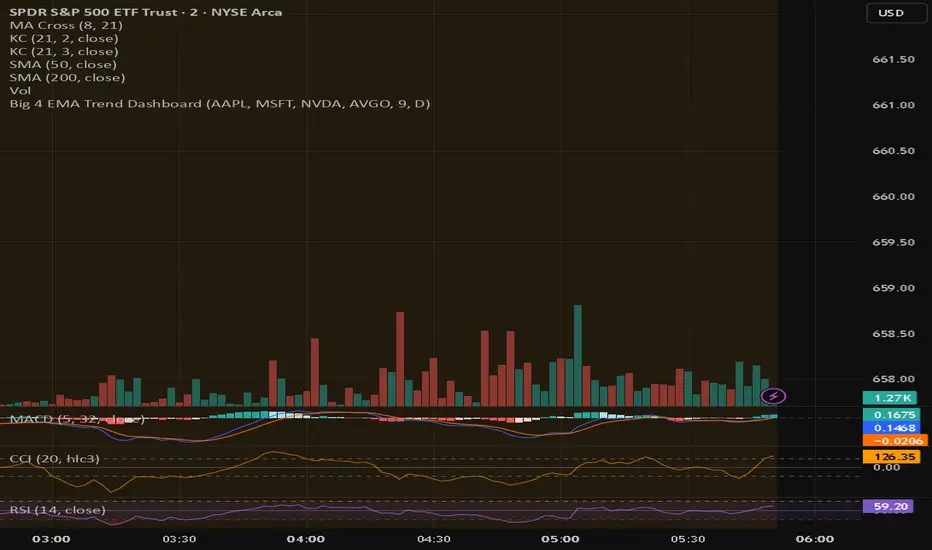
Quickly see the trend direction of your top four stocks using a customizable EMA. Each stock shows as a colored tile: green if price is above the EMA, red if below. A summary label shows whether all four stocks are trending up, down, or mixed.
Key Features:
Track 4 user-defined symbols at a glance
Custom EMA length and optional timeframe override
Compact dashboard ideal for scalping and day trading
Key Features:
Track 4 user-defined symbols at a glance
Custom EMA length and optional timeframe override
Compact dashboard ideal for scalping and day trading
オープンソーススクリプト
TradingViewの精神に則り、このスクリプトの作者はコードをオープンソースとして公開してくれました。トレーダーが内容を確認・検証できるようにという配慮です。作者に拍手を送りましょう!無料で利用できますが、コードの再公開はハウスルールに従う必要があります。
免責事項
この情報および投稿は、TradingViewが提供または推奨する金融、投資、トレード、その他のアドバイスや推奨を意図するものではなく、それらを構成するものでもありません。詳細は利用規約をご覧ください。
オープンソーススクリプト
TradingViewの精神に則り、このスクリプトの作者はコードをオープンソースとして公開してくれました。トレーダーが内容を確認・検証できるようにという配慮です。作者に拍手を送りましょう!無料で利用できますが、コードの再公開はハウスルールに従う必要があります。
免責事項
この情報および投稿は、TradingViewが提供または推奨する金融、投資、トレード、その他のアドバイスや推奨を意図するものではなく、それらを構成するものでもありません。詳細は利用規約をご覧ください。